Tutorial list
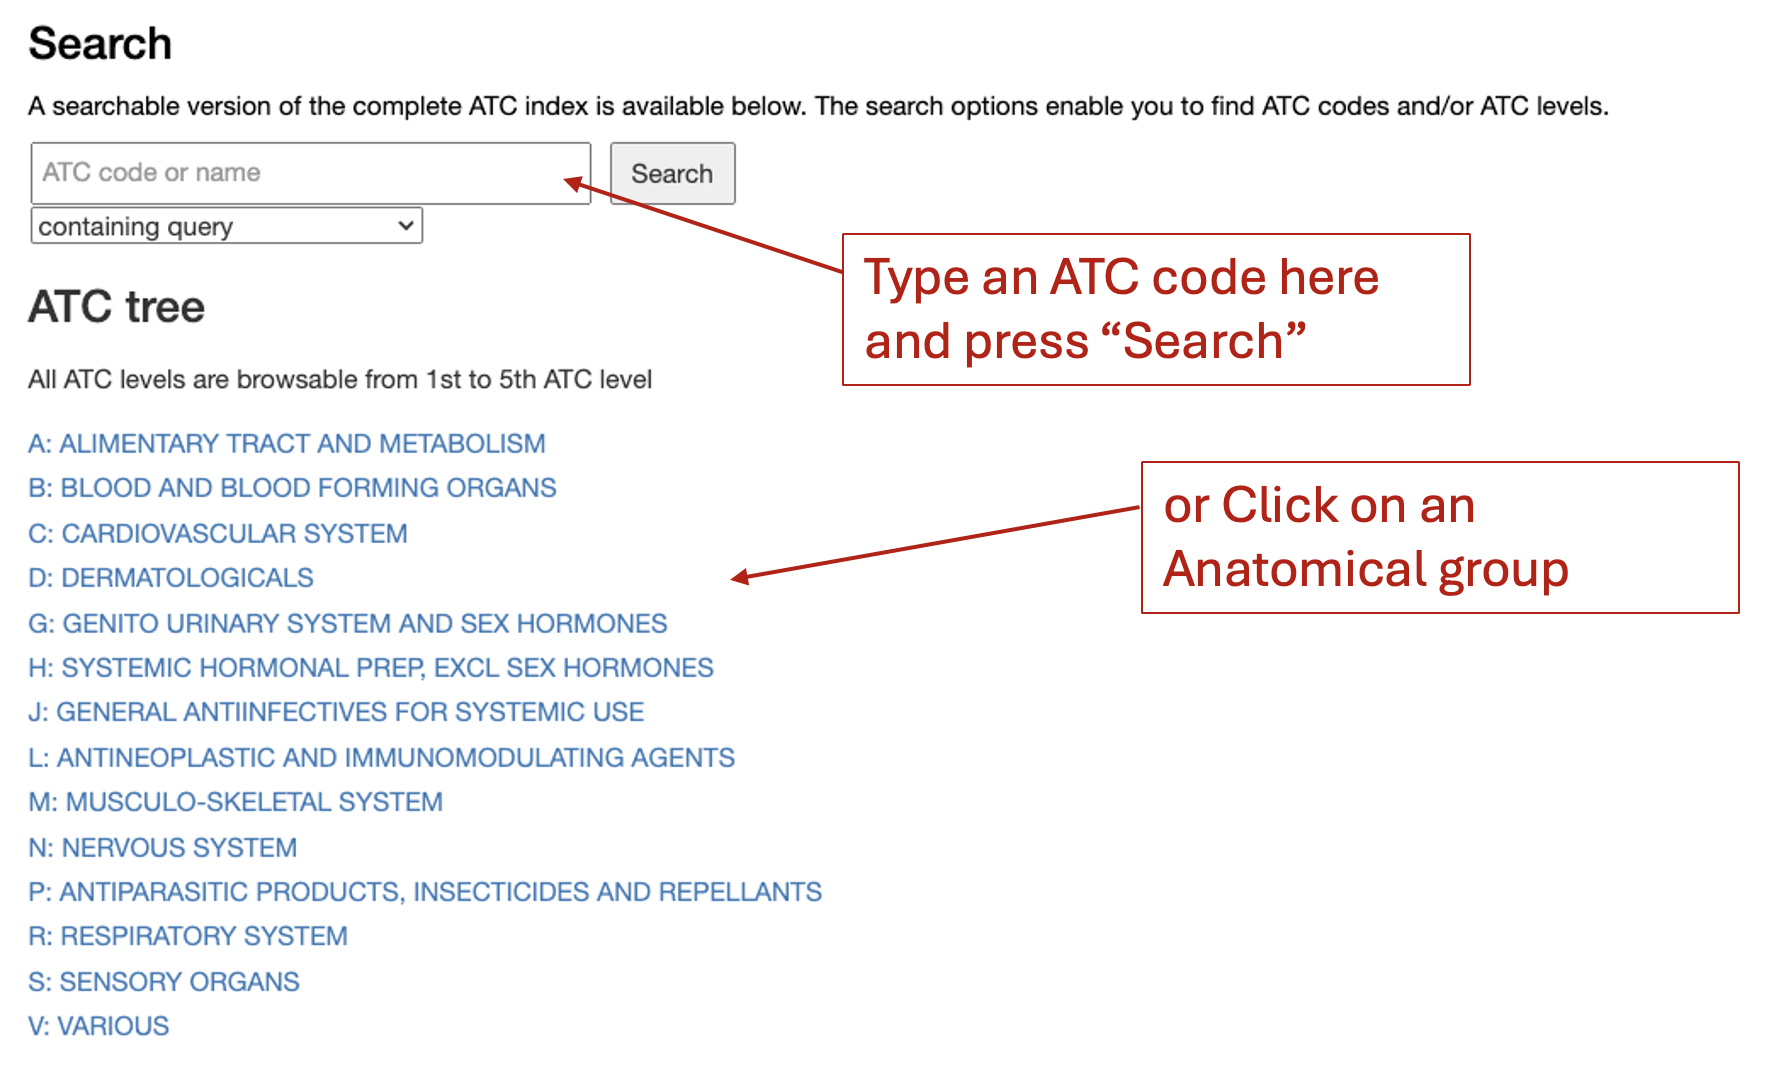
Search or Browse to any ATC code of interest
From menu 'ATC codes/ATC classification hierachy browser', users can input a single ATC code or browse in the ATC tree to launch the search process. The ATC tree starts with 14 Anatomical groups.
Video: Watch the video guide here
Explore the drug-indication and -target network associated with an ATC code of interest
The ‘ATC classification hierarchy browser’ on the left is 5-tiered, beginning with the anatomical group and narrowing down through therapeutic, pharmacological, and chemical groups to a specific 7-character chemical substance code. Clicking any ATC code reveals a network illustrating drug-protein interactions and/ or drug-indication associations.
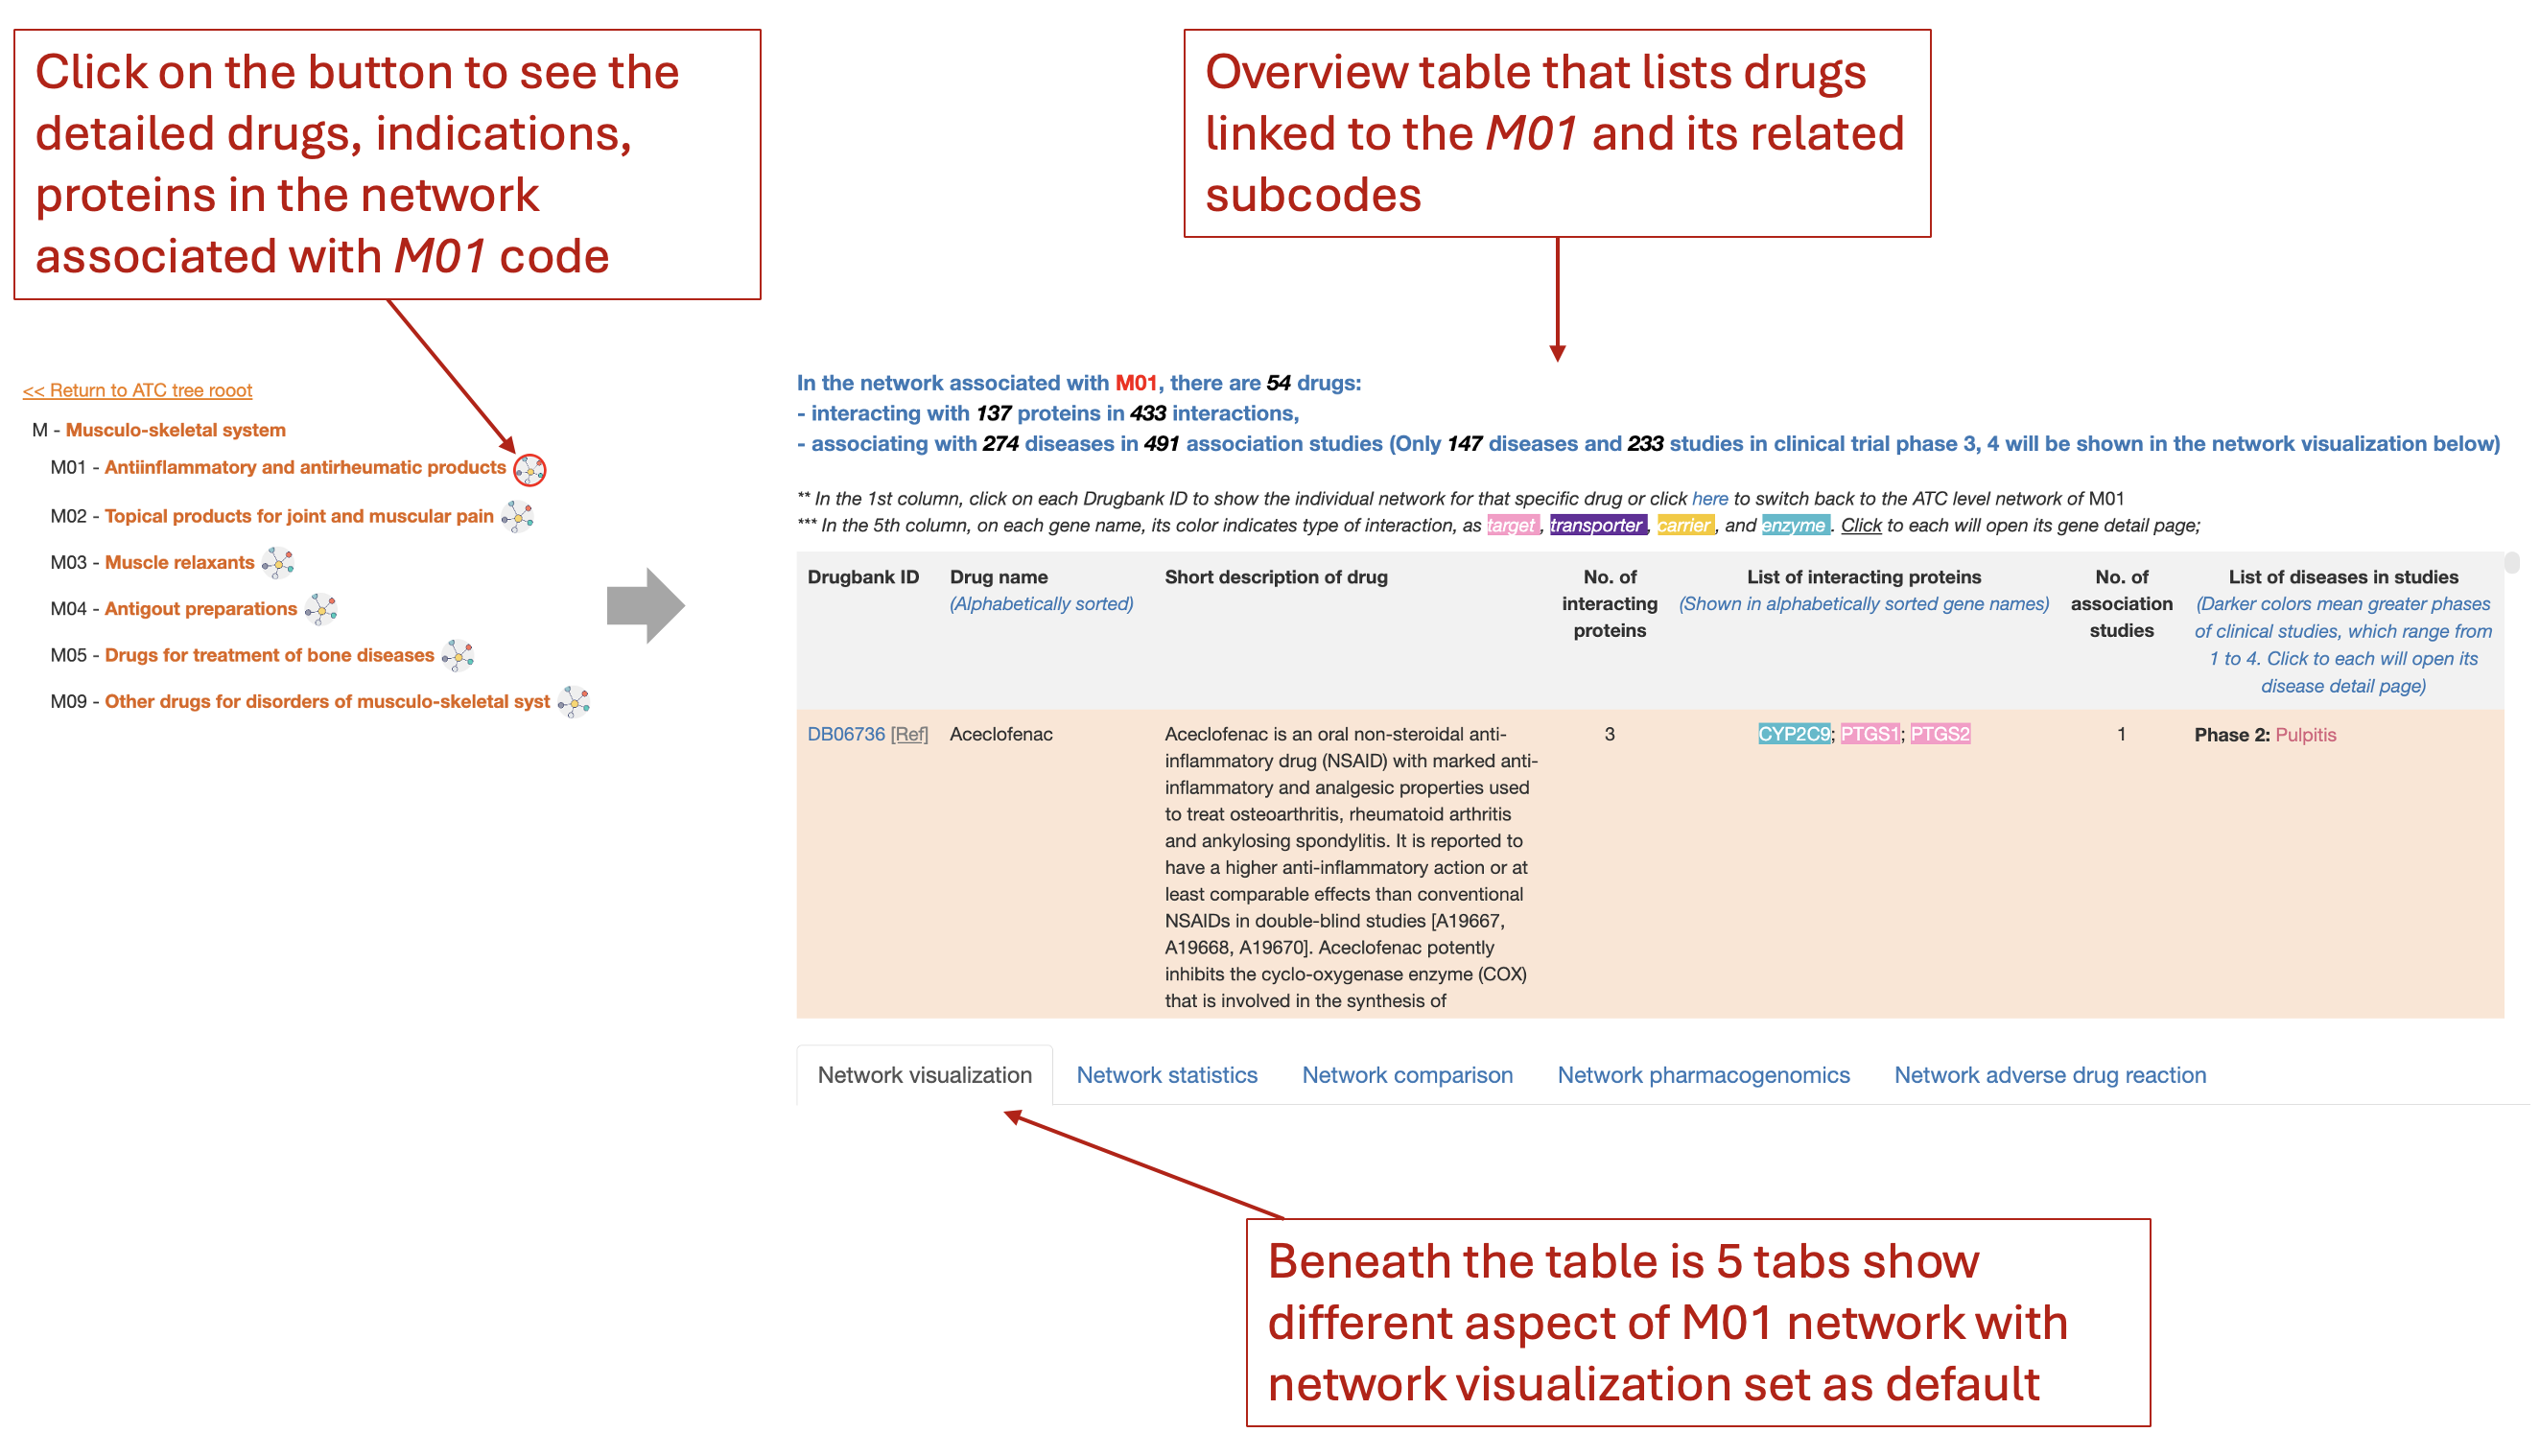
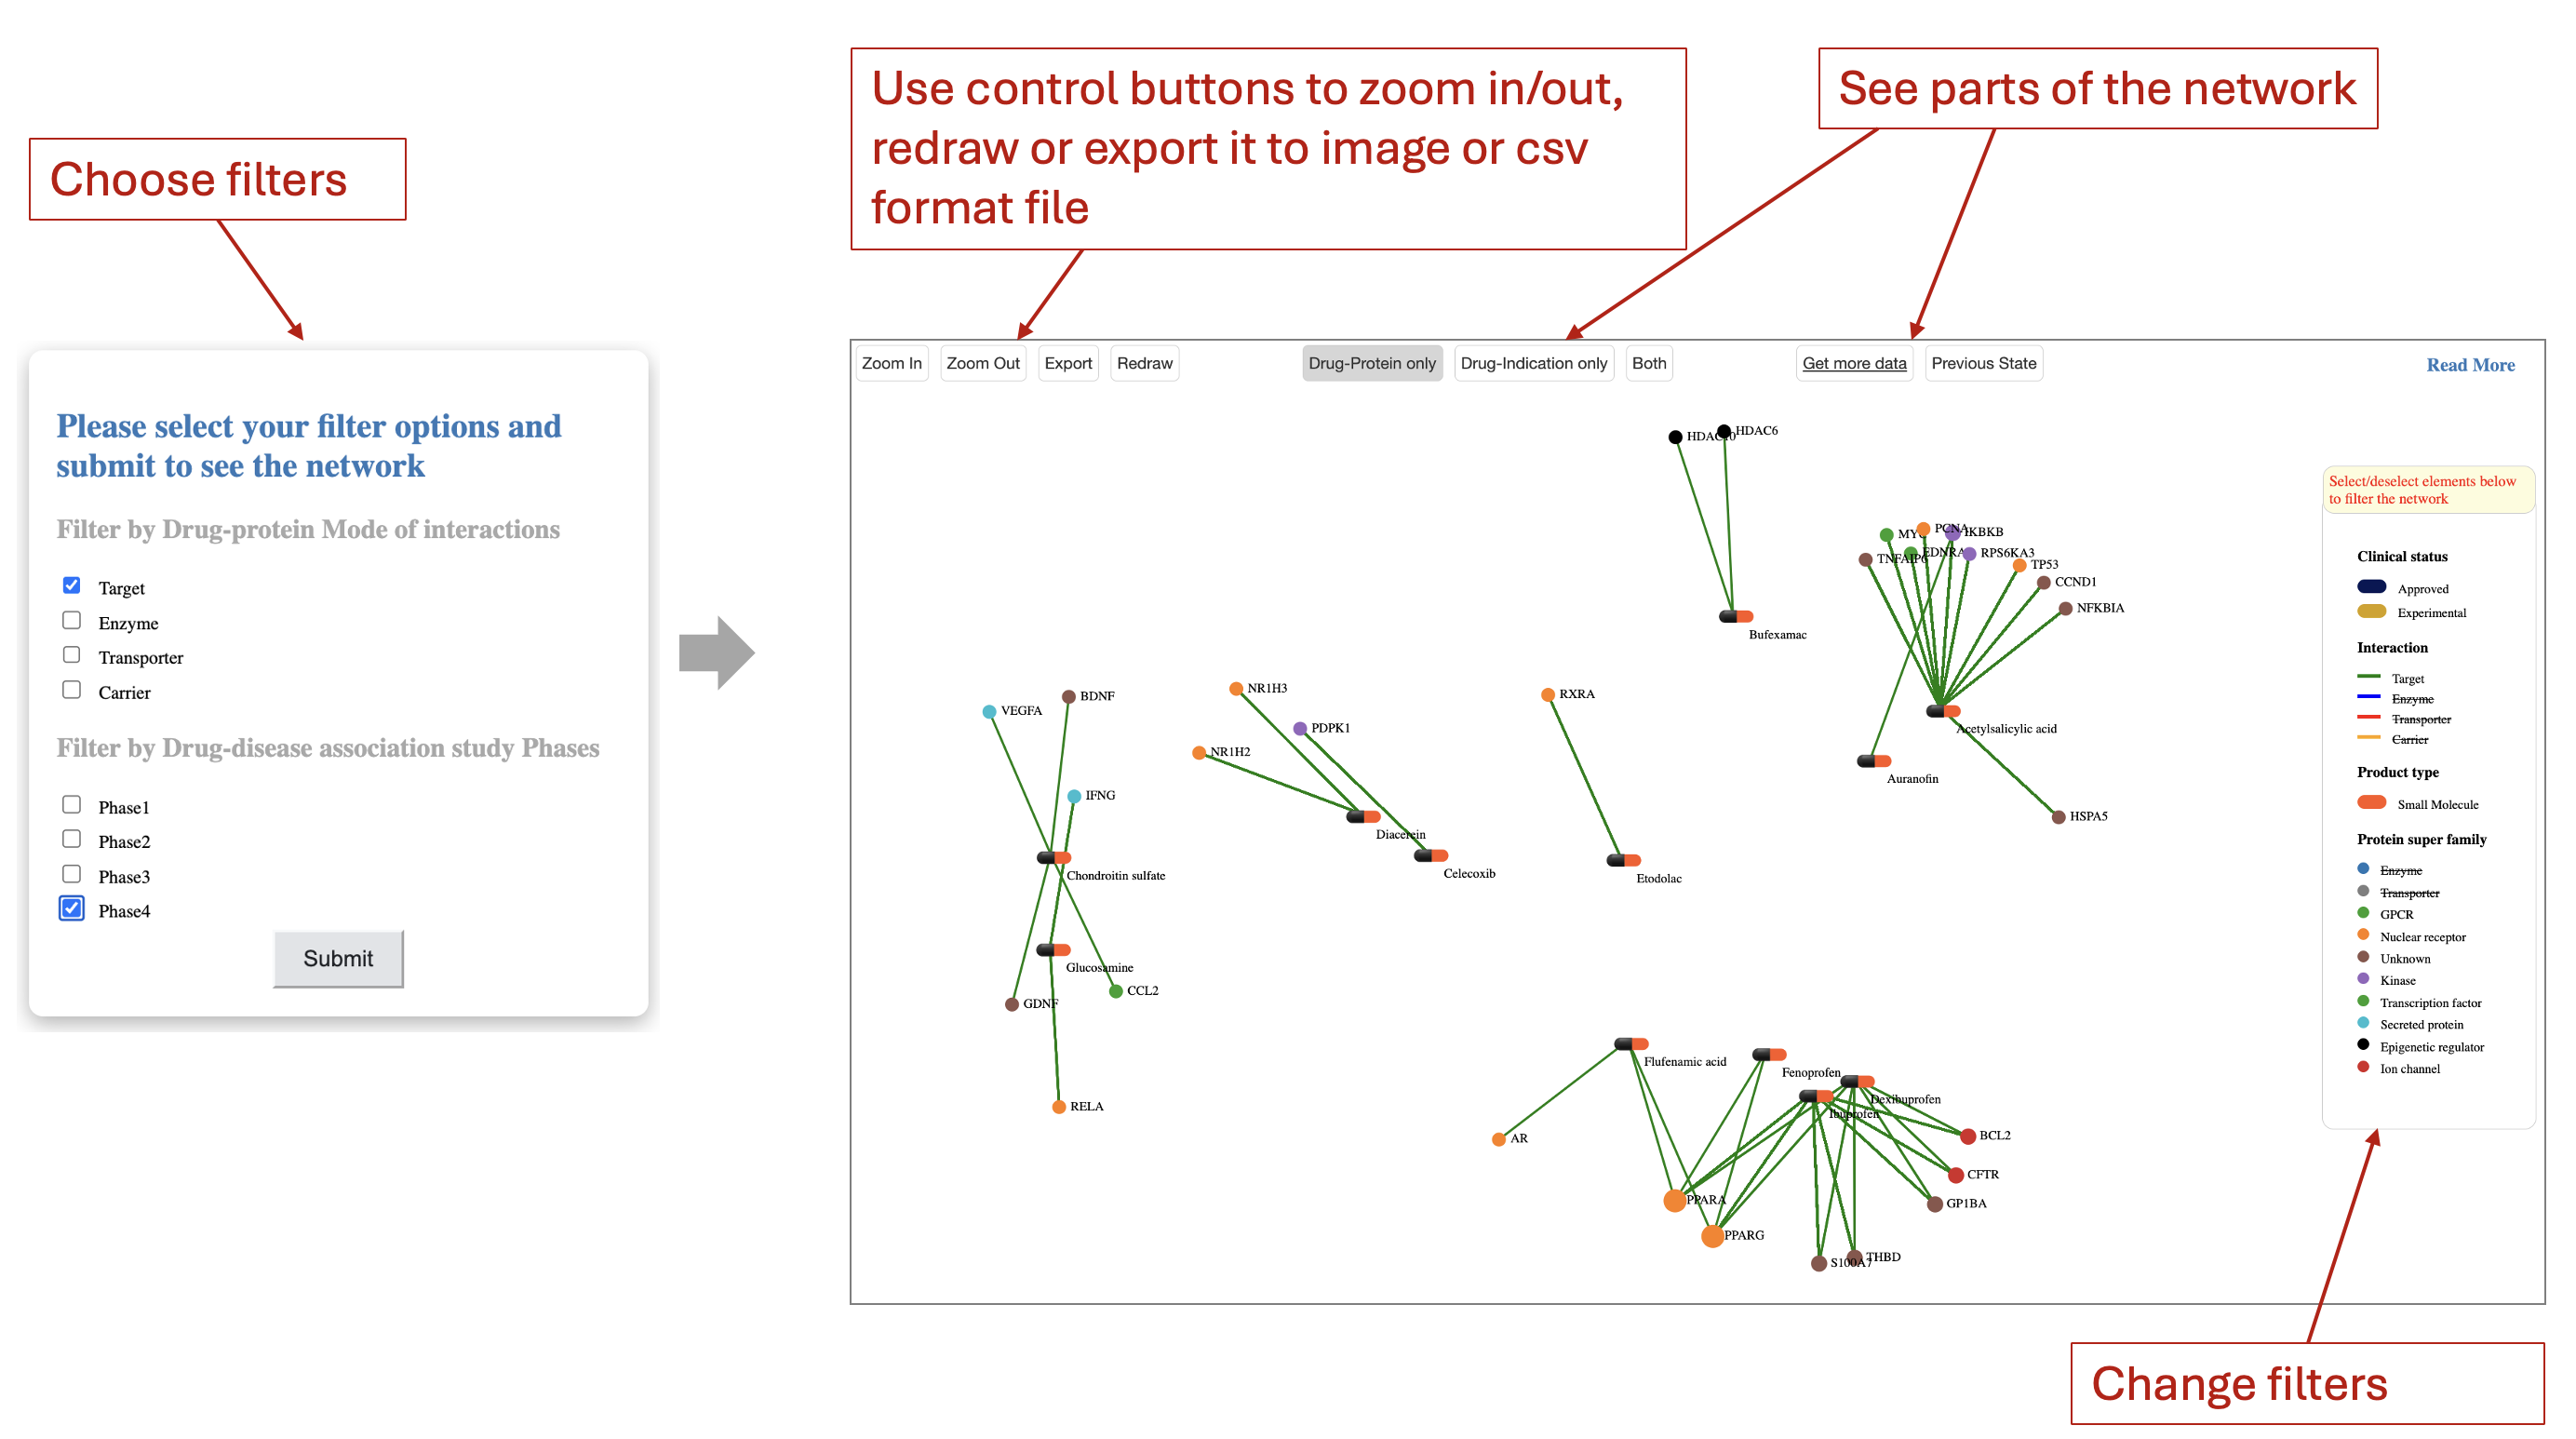
Network visualization tab provides a tripartite network visualization with drugs, targets, and indication nodes. User will need first filter the types of Drug-protein mode of actions and the clinical trial phase of Drug-indication association studies.
Video: Watch the video guide here
Search a drug of interest
Users can input a single drug name or drug bank ID on the 'Drug search' page to launch the search process. The table beneath gives quick drug examples
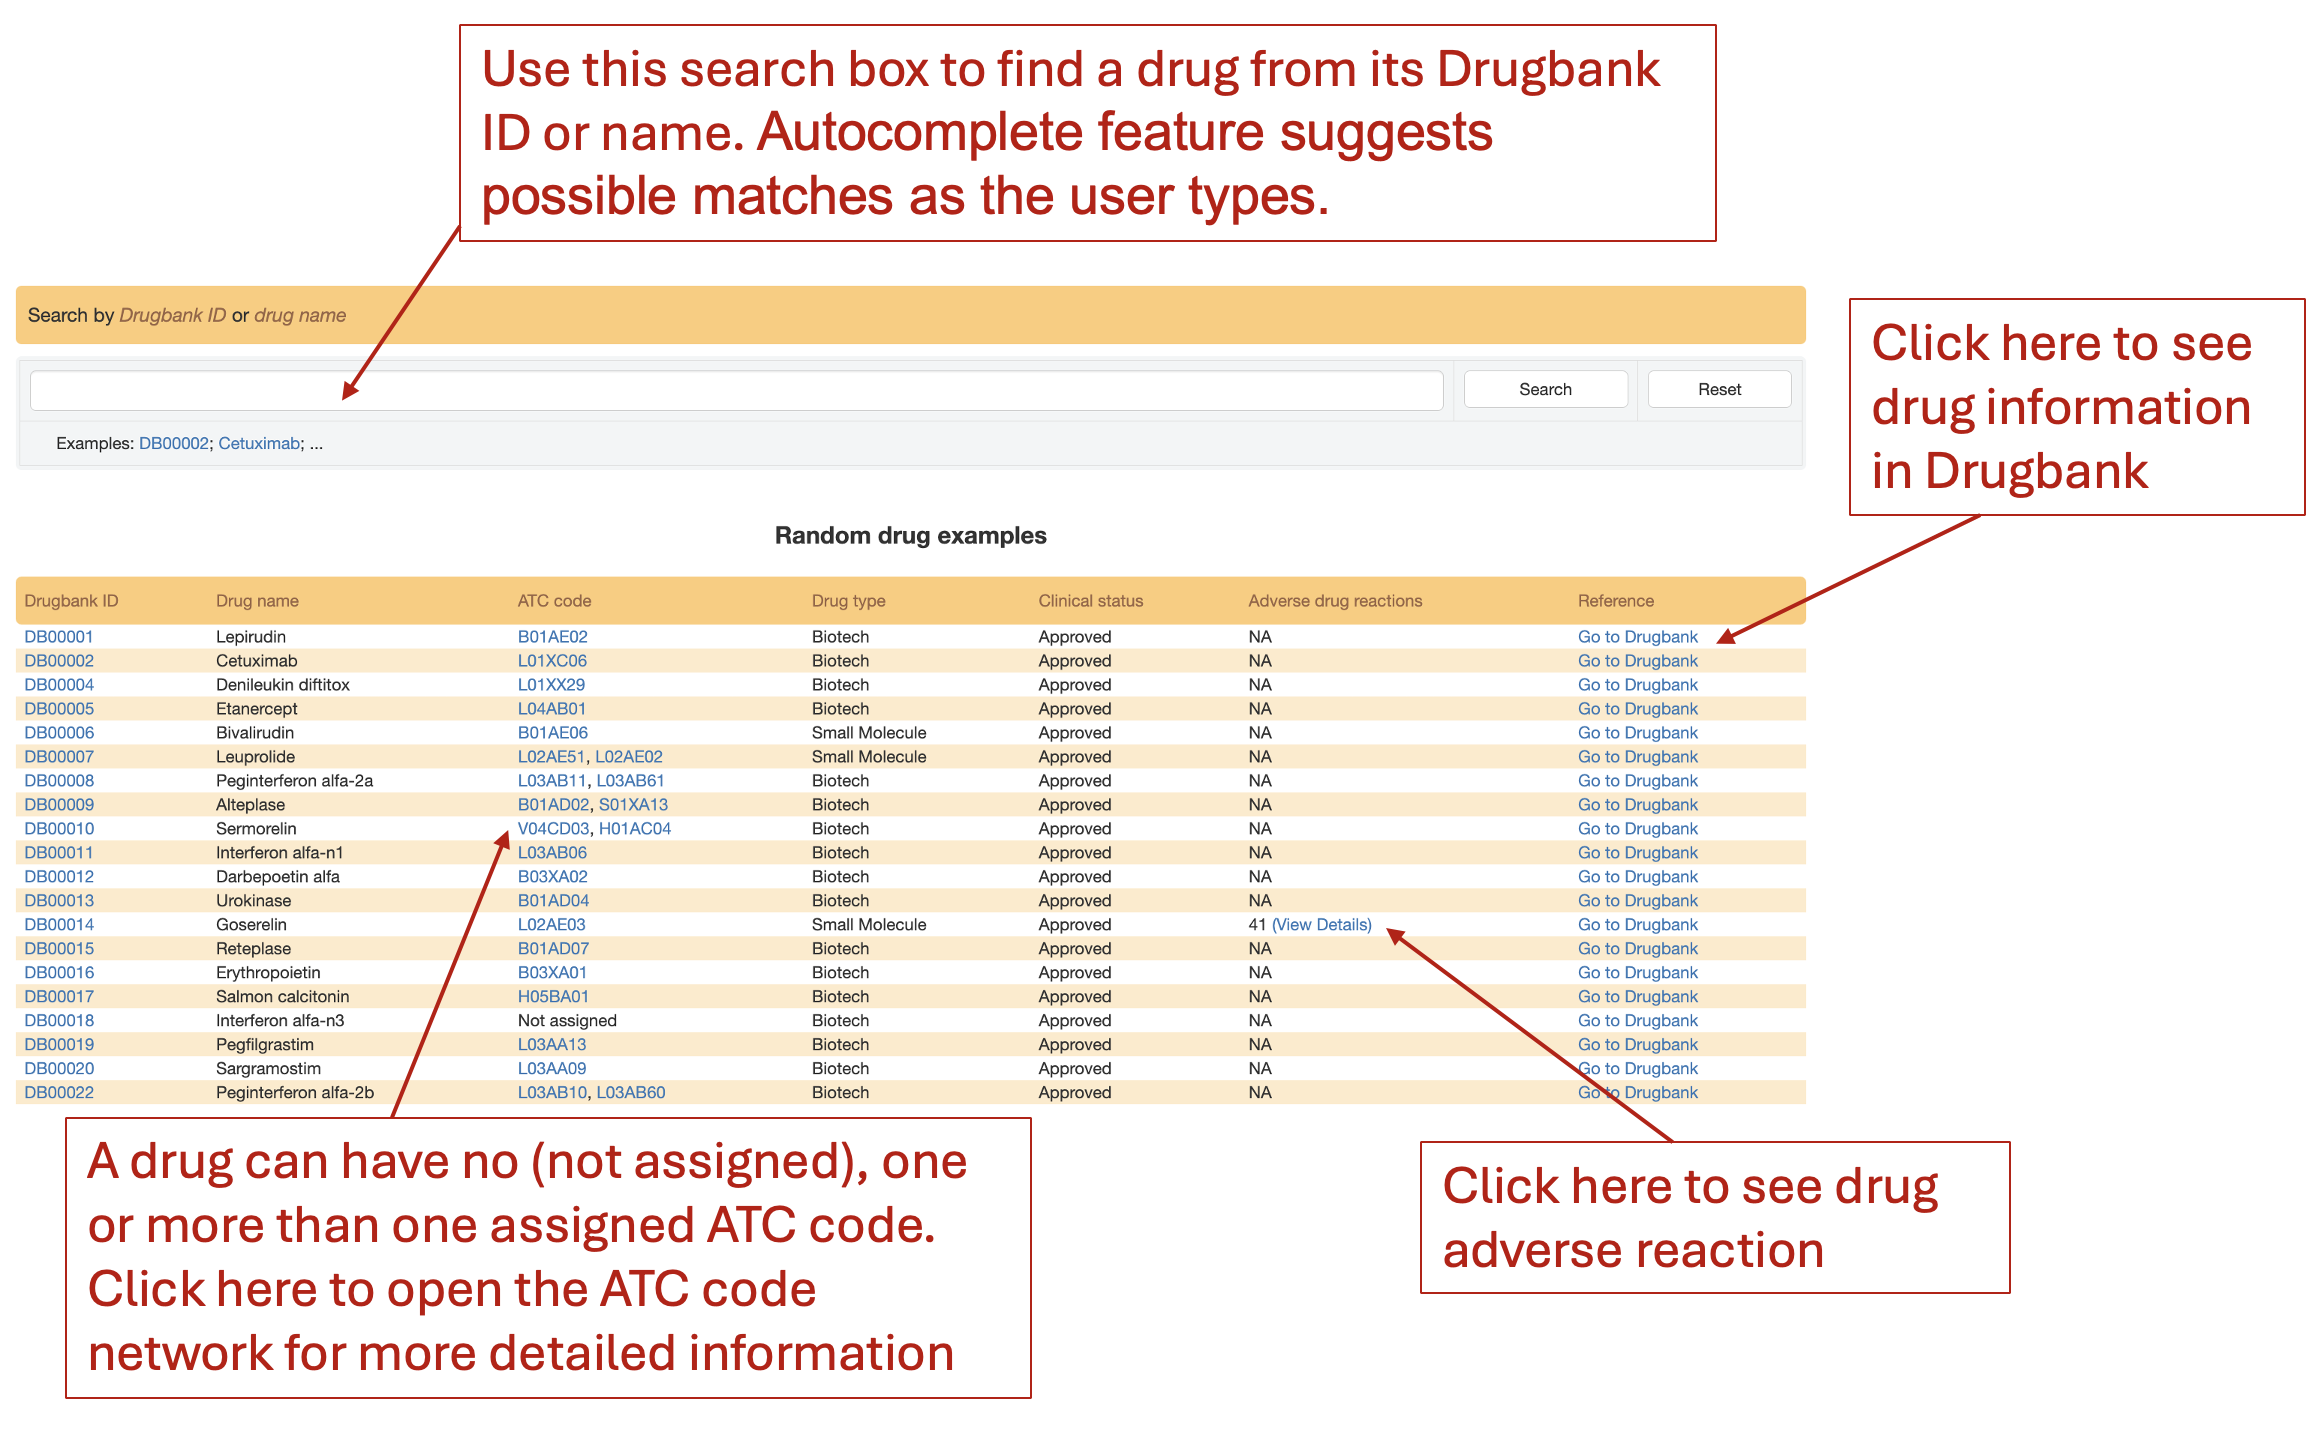
Find side effects with high frequencies of a drug
Input a single drug name or drug bank ID (i.e., Bepridil) on the 'Drug search' page. The side effects information can be found in the "Adverse drug reactions" column of the result table
In this example for "Bepridil", there are 11 side effects. Click on "View detail" will open a pop-up windows listing all the side effects and their frequencies. The side effects are sorted descendingly based on frequencies (in brackets) in the surveyed populations. Click on the "i" icon to see the definition of side effects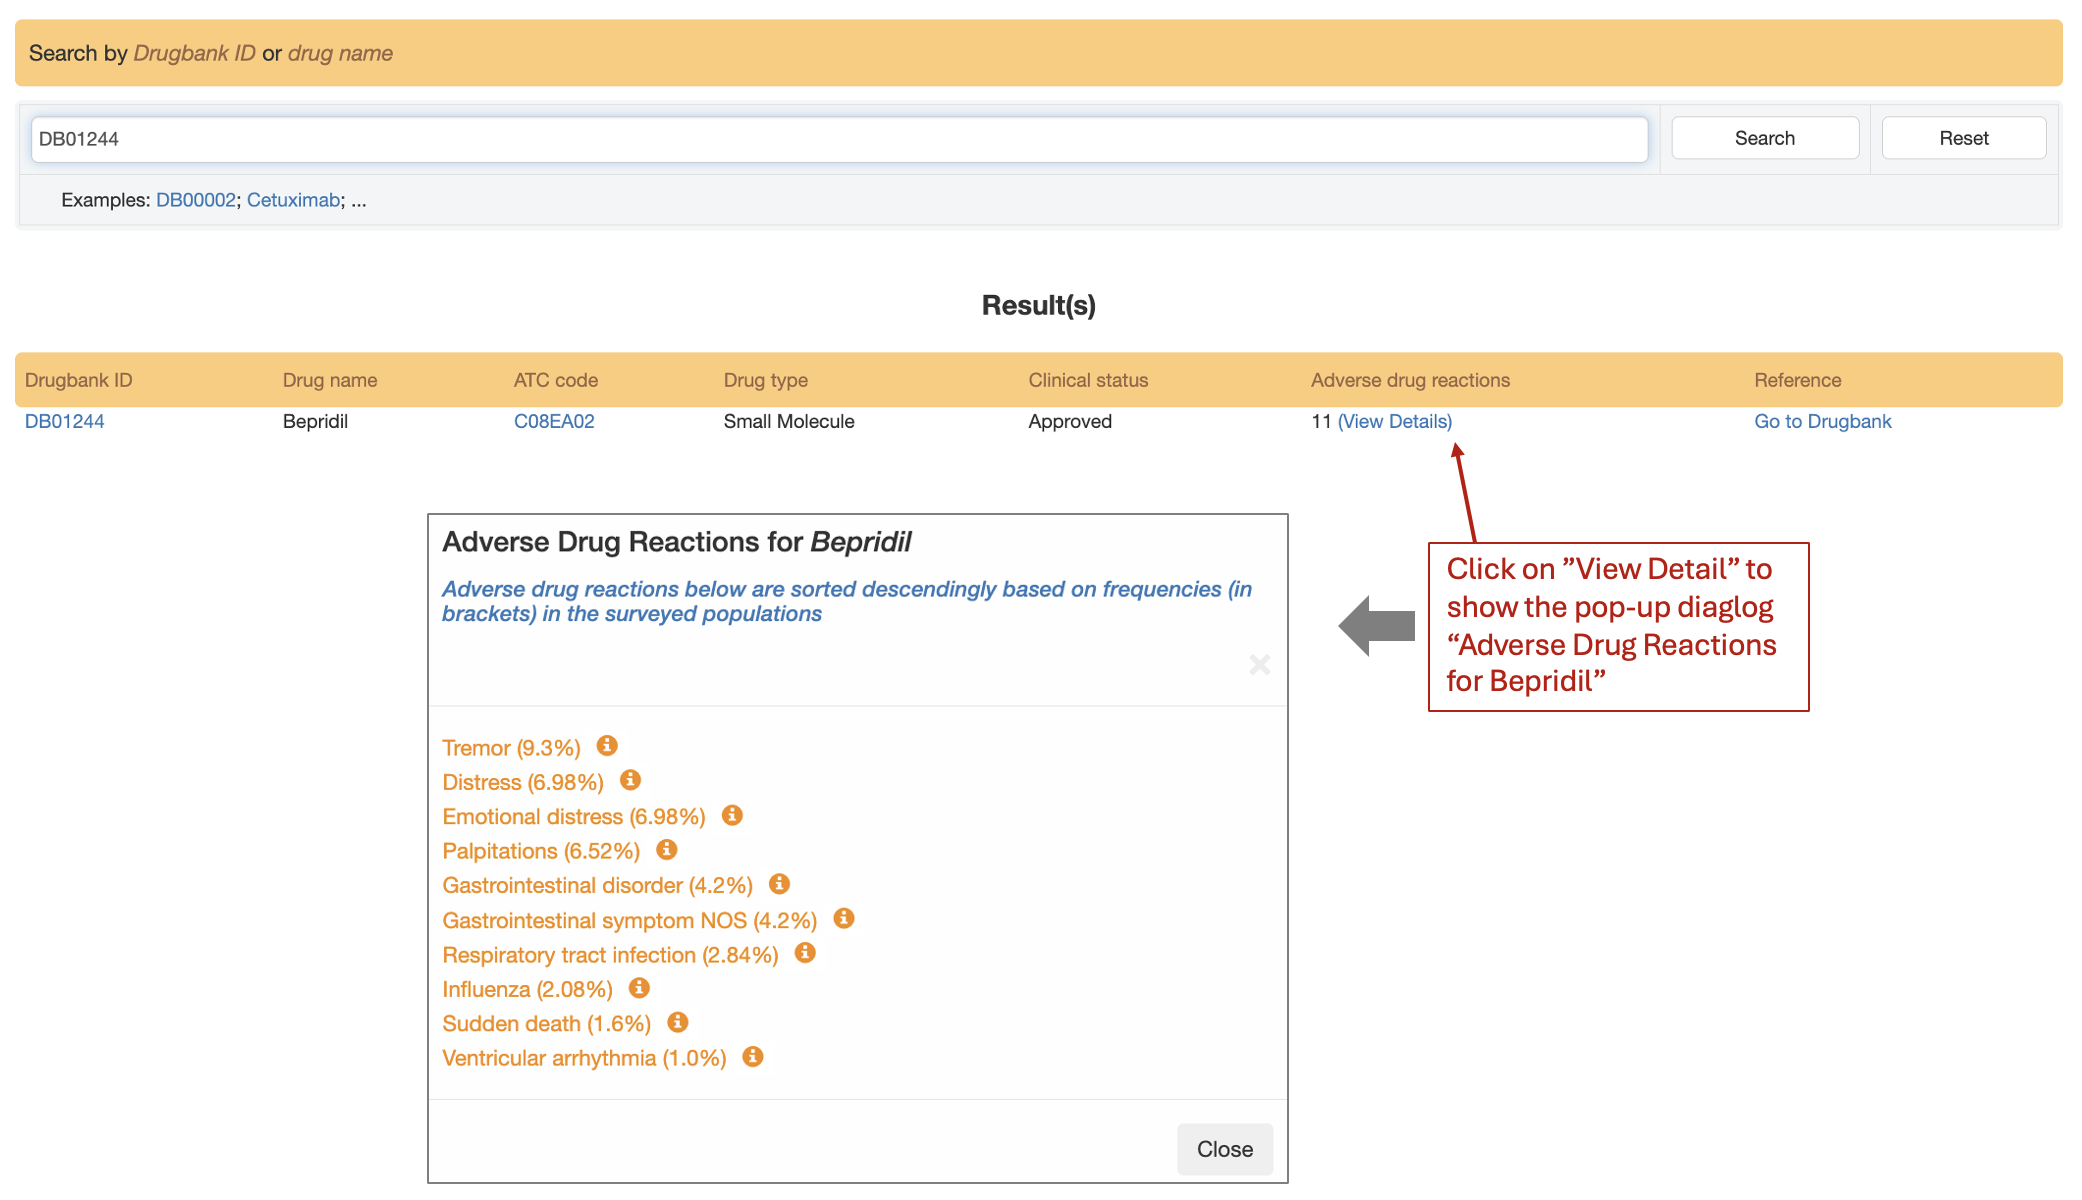
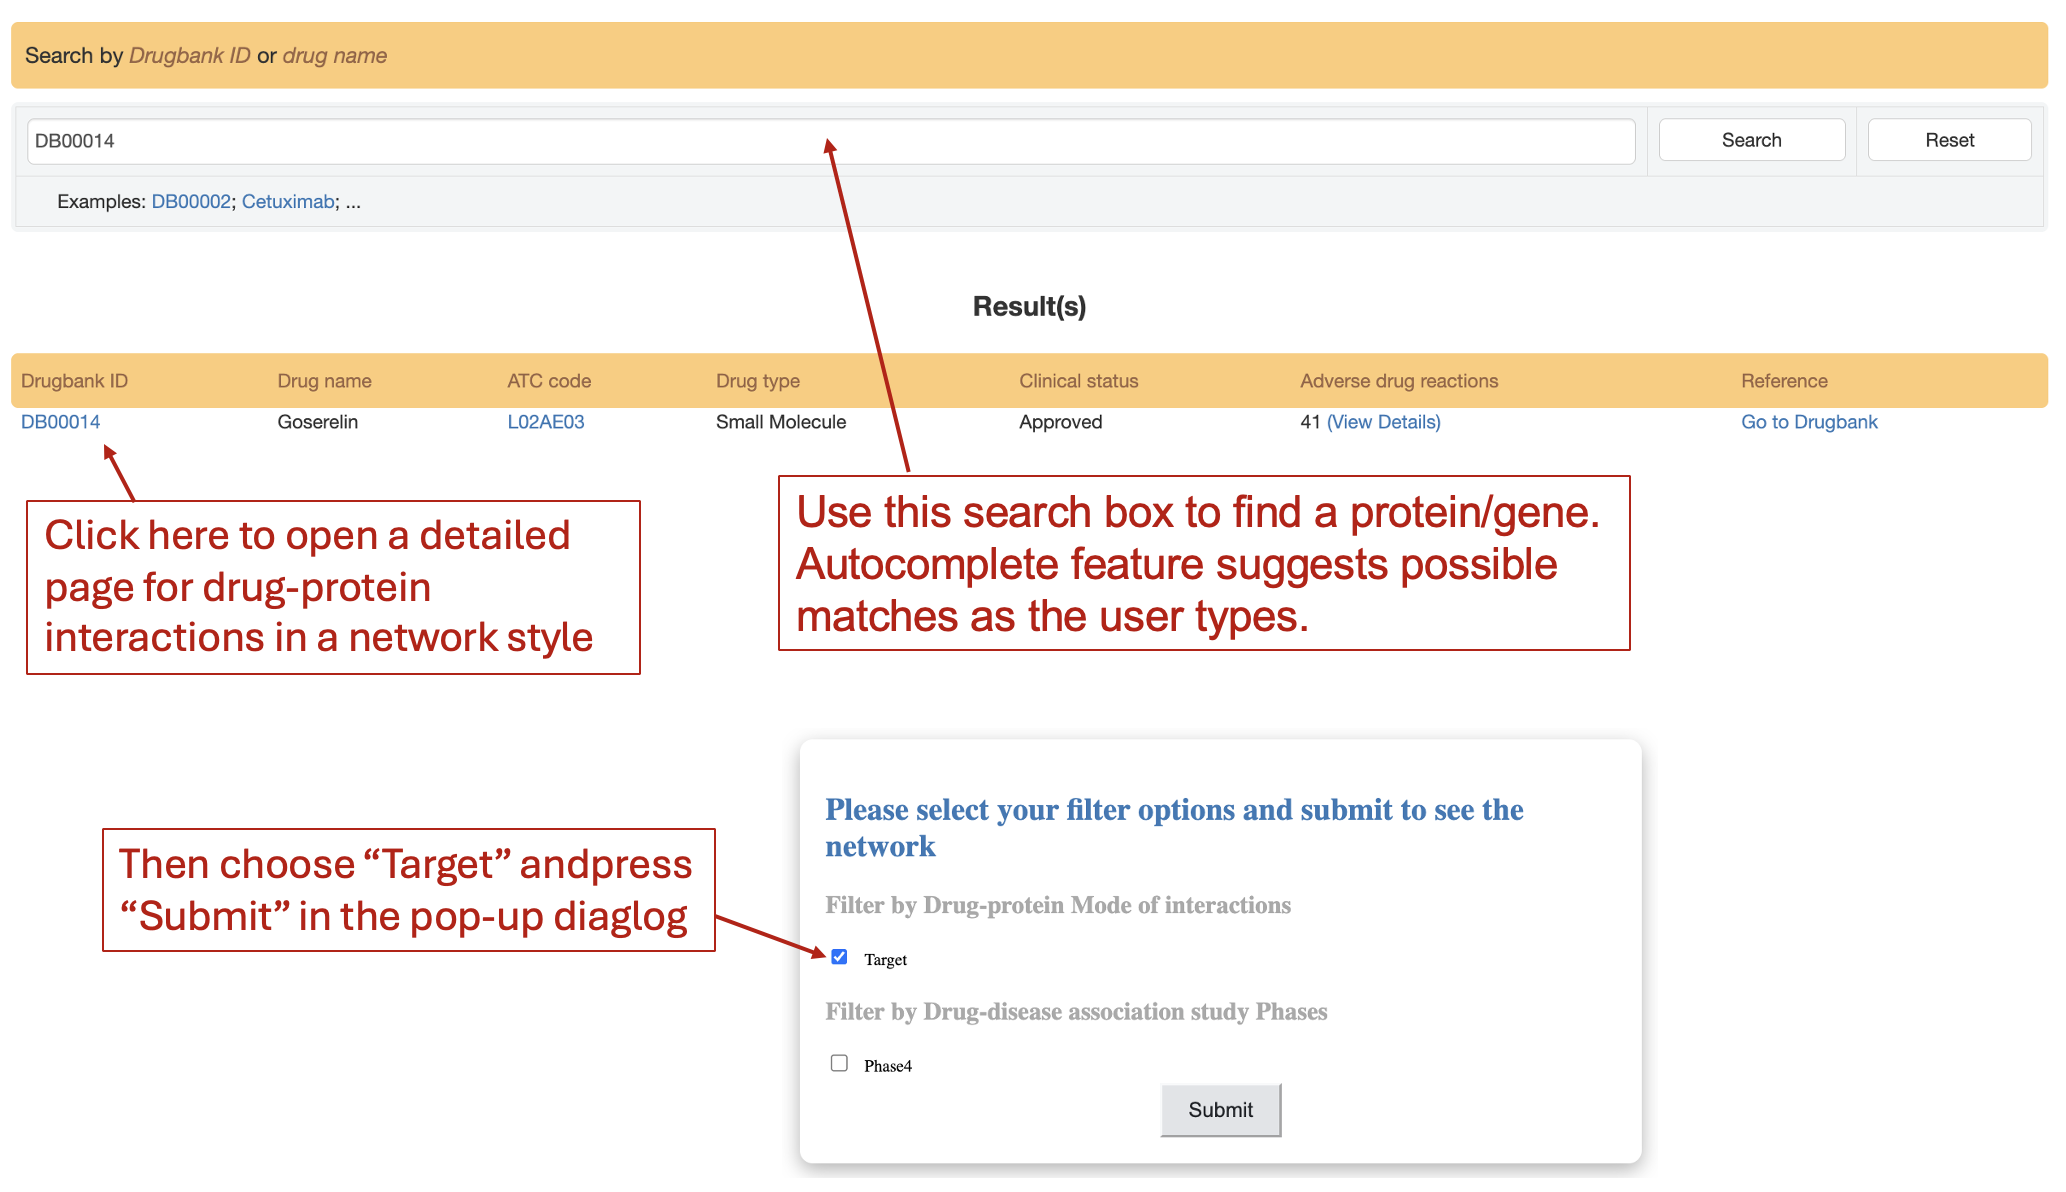
Find targets of a drugs and details about those targets
Objective: Given a drug, find how many targets this drug has and their detailed information such as family, variant profile
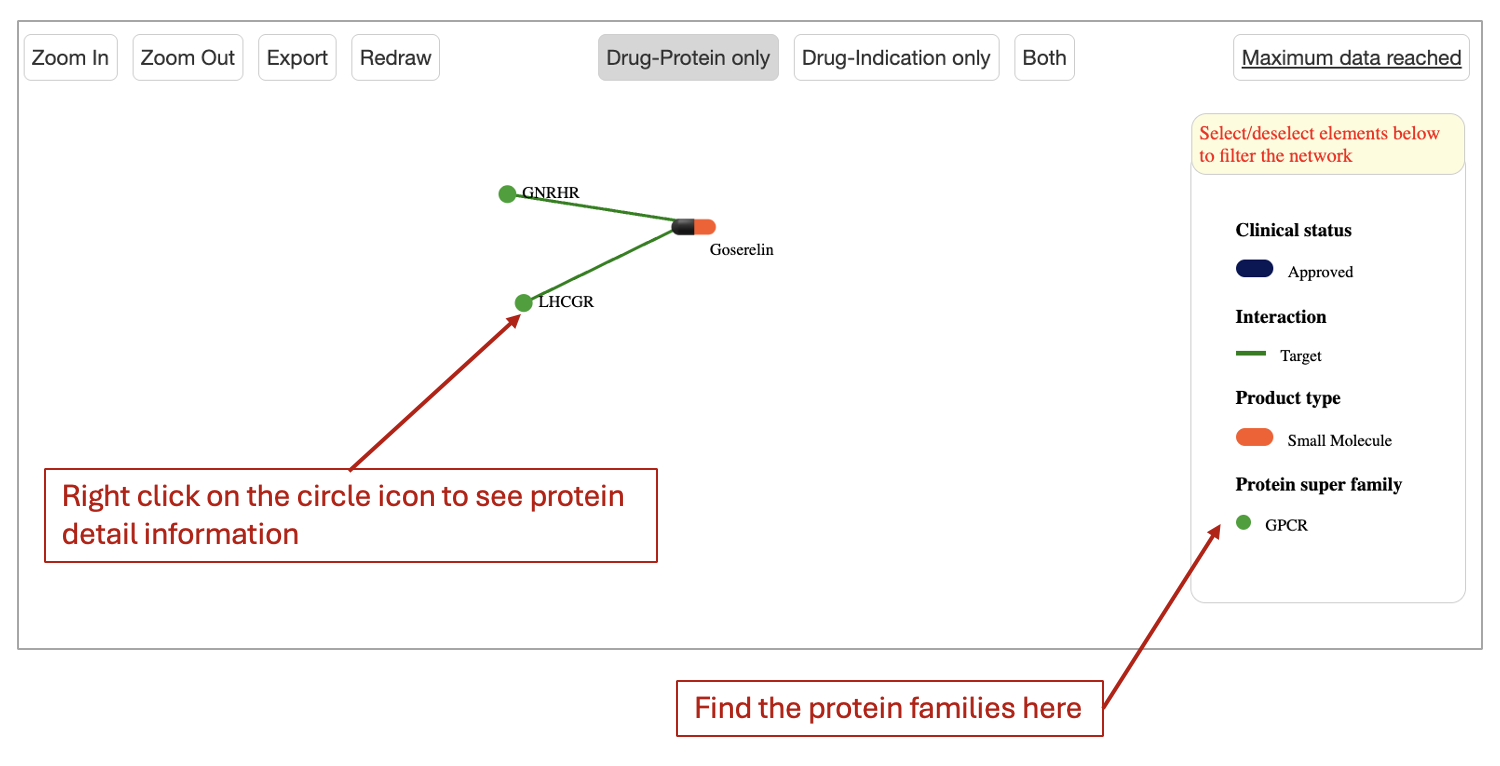
How: First, navigating to the 'Drug search' page, enter the drug name or it DrugBank ID (e.g. Goserelin) in the search box. Second, click on the link in the "DrugBankID" column in the "Result(s)" table to open the new page. The interactions of the drug will be show in a network style.
Expected results: (This screenshot shows only a portion of the full results).
Search result table
In the network, click on protein (display in gene names) icons (circle shapes) to see for information of the protein. Check out the legend to see protein family or filter out certain families.
Find maximum clinical phase of an indication/drug
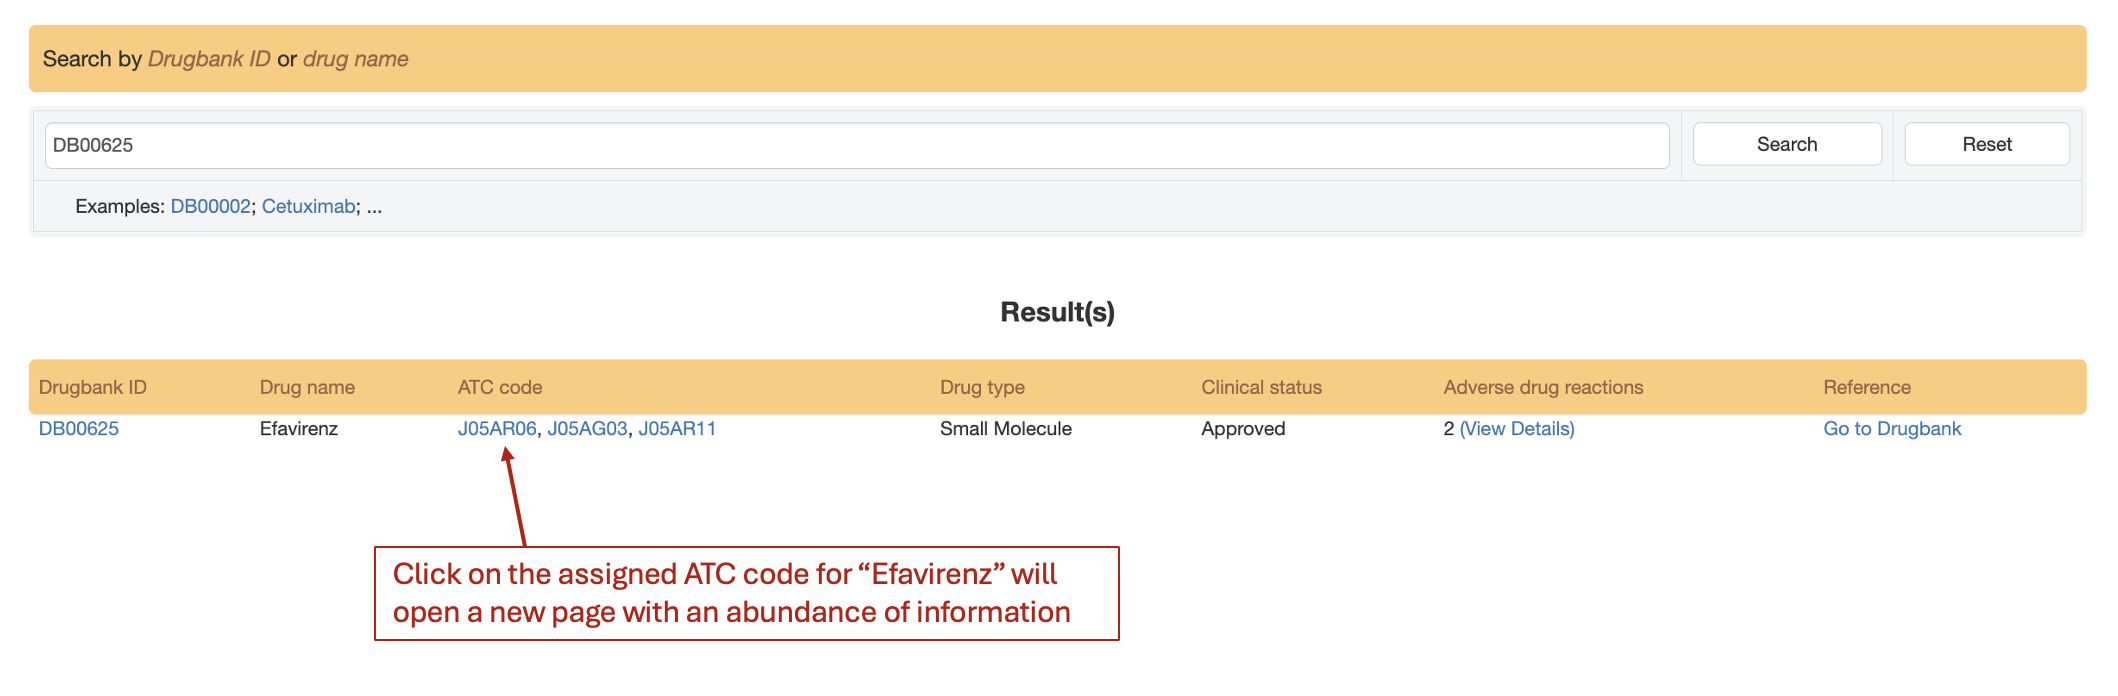
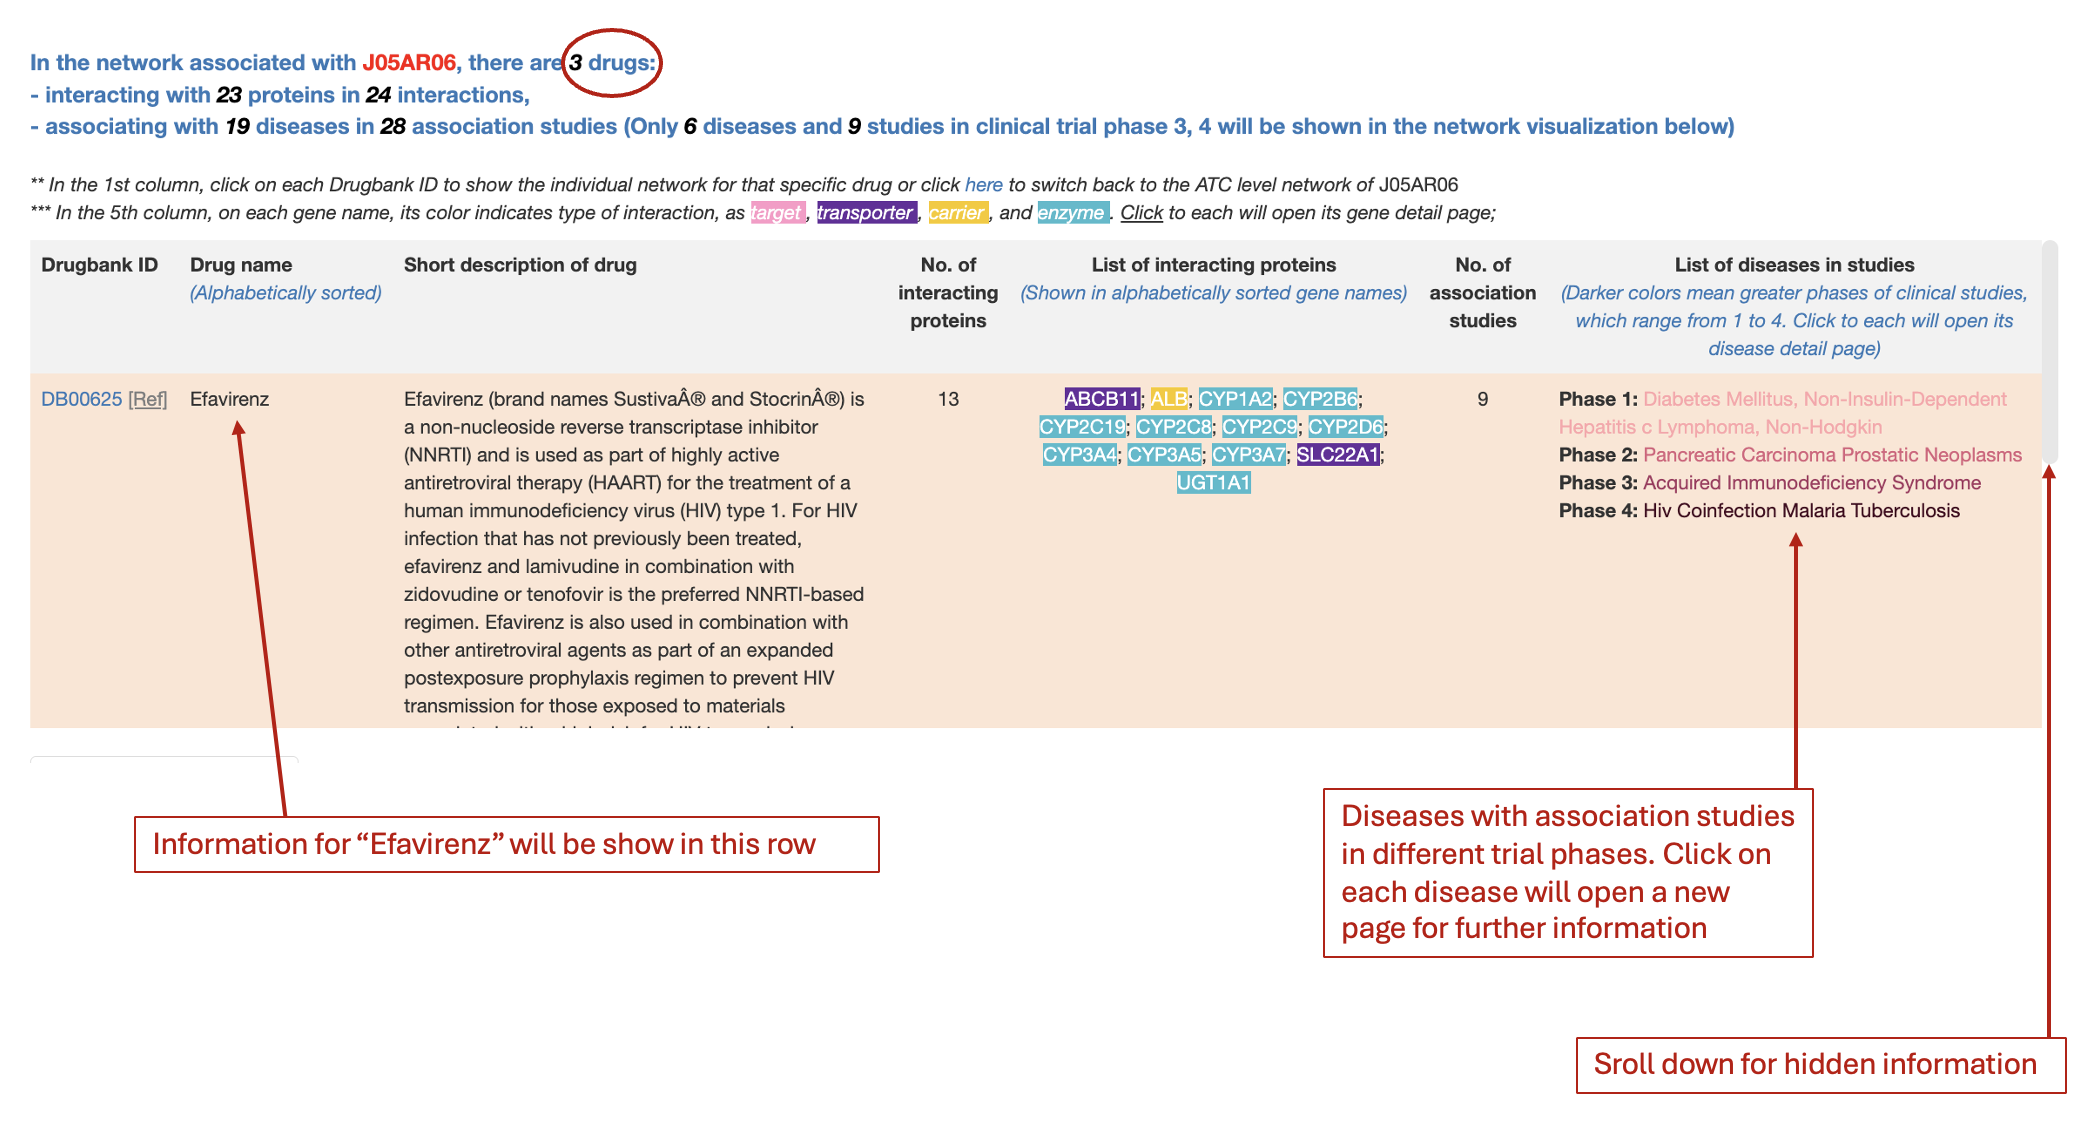
Input a single drug name or drug bank ID (i.e., Efavirenz) on the 'Drug search' page. Click on ATC code in the "ATC code" column. The diseases with their disease-indication association studies will be shown in a network style
In this example for "Efavirenz", its has 3 ATC codes: "J05AR06", "J05AG03", and "J05AR11". Click on the link underlying code, i.e., "J05AR06" will open a new page. There is an abundance of information in this page.
To see the maximum clinical trials, look into the upper table in the right panel at the "List of diseases in studies" columns. The diseases will be listed and arranged based on the phases of trials
Find diseases in clinical trial phase 4 of a drug, details about those diseases
Input a single drug name or drug bank ID (i.e., Efavirenz) on the 'Drug search' page. Click on ATC code in the "ATC code" column. The diseases with their disease-indication association studies will be shown in a network style
In this example for "Efavirenz", its has 3 ATC codes: "J05AR06", "J05AG03", and "J05AR11". Click on the link underlying code, i.e., "J05AR06" will open a new page. There is an abundance of information in this page.
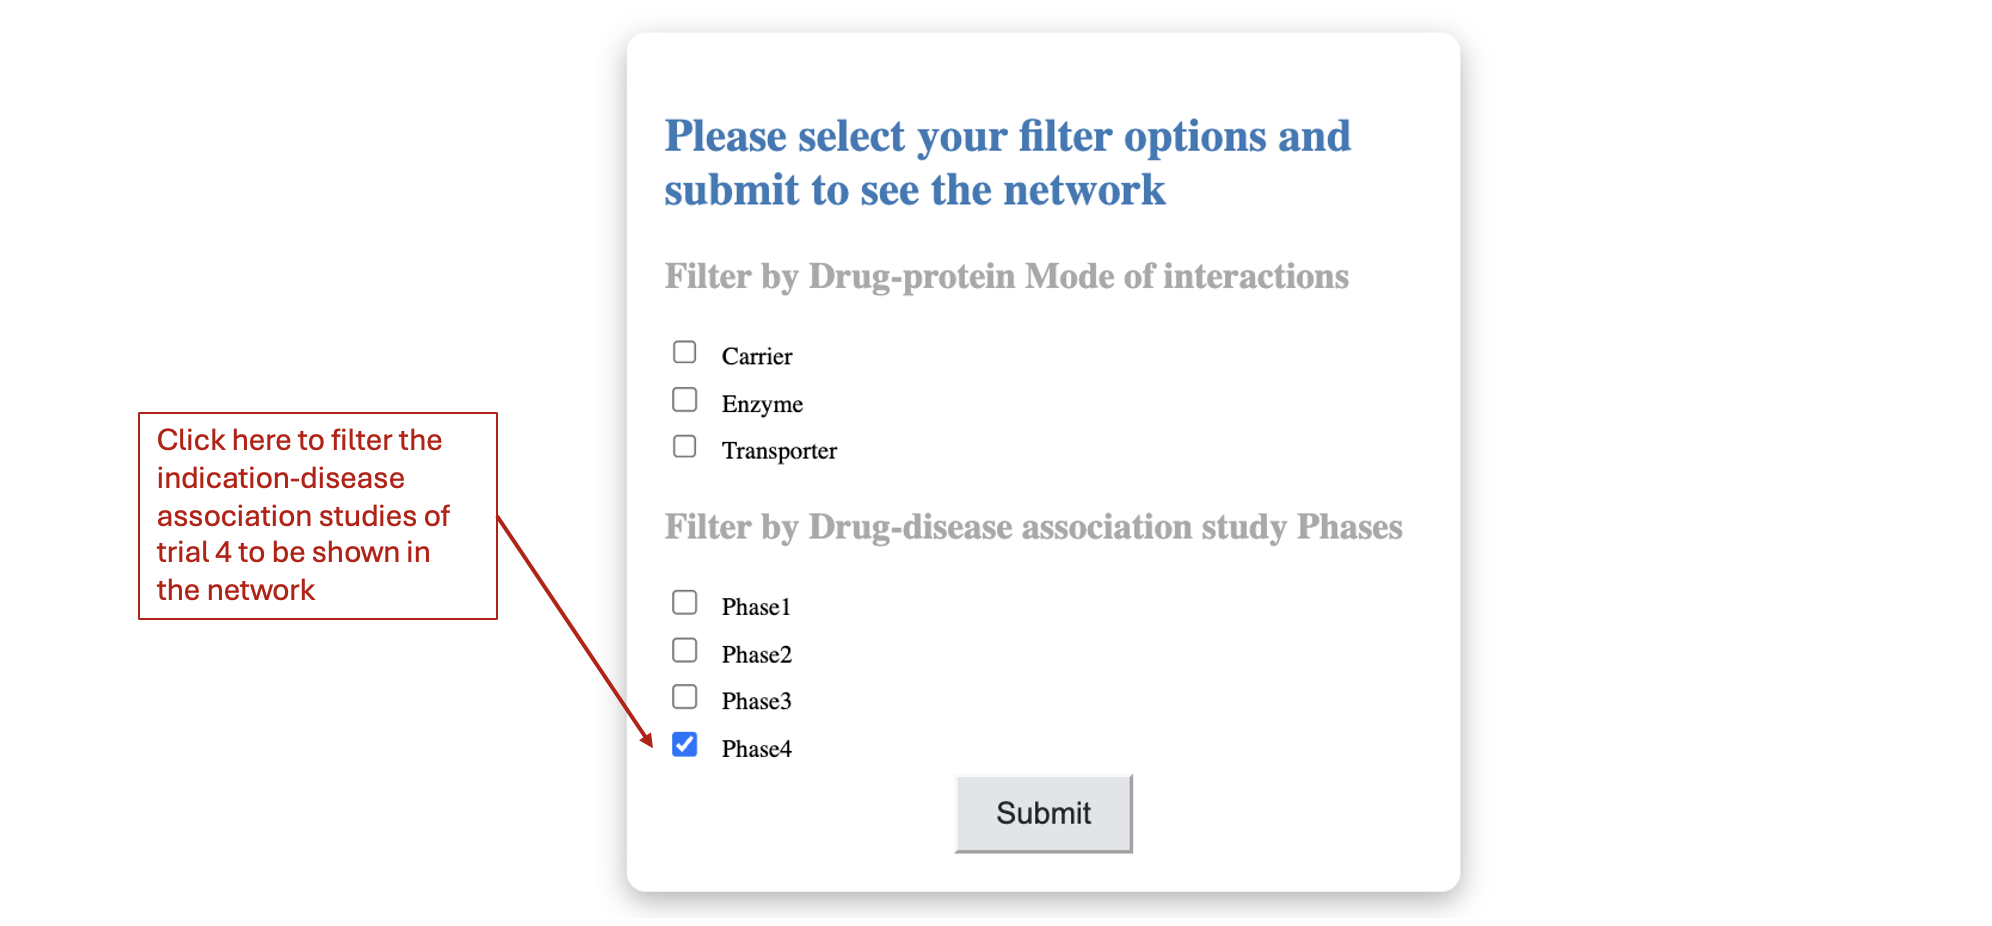
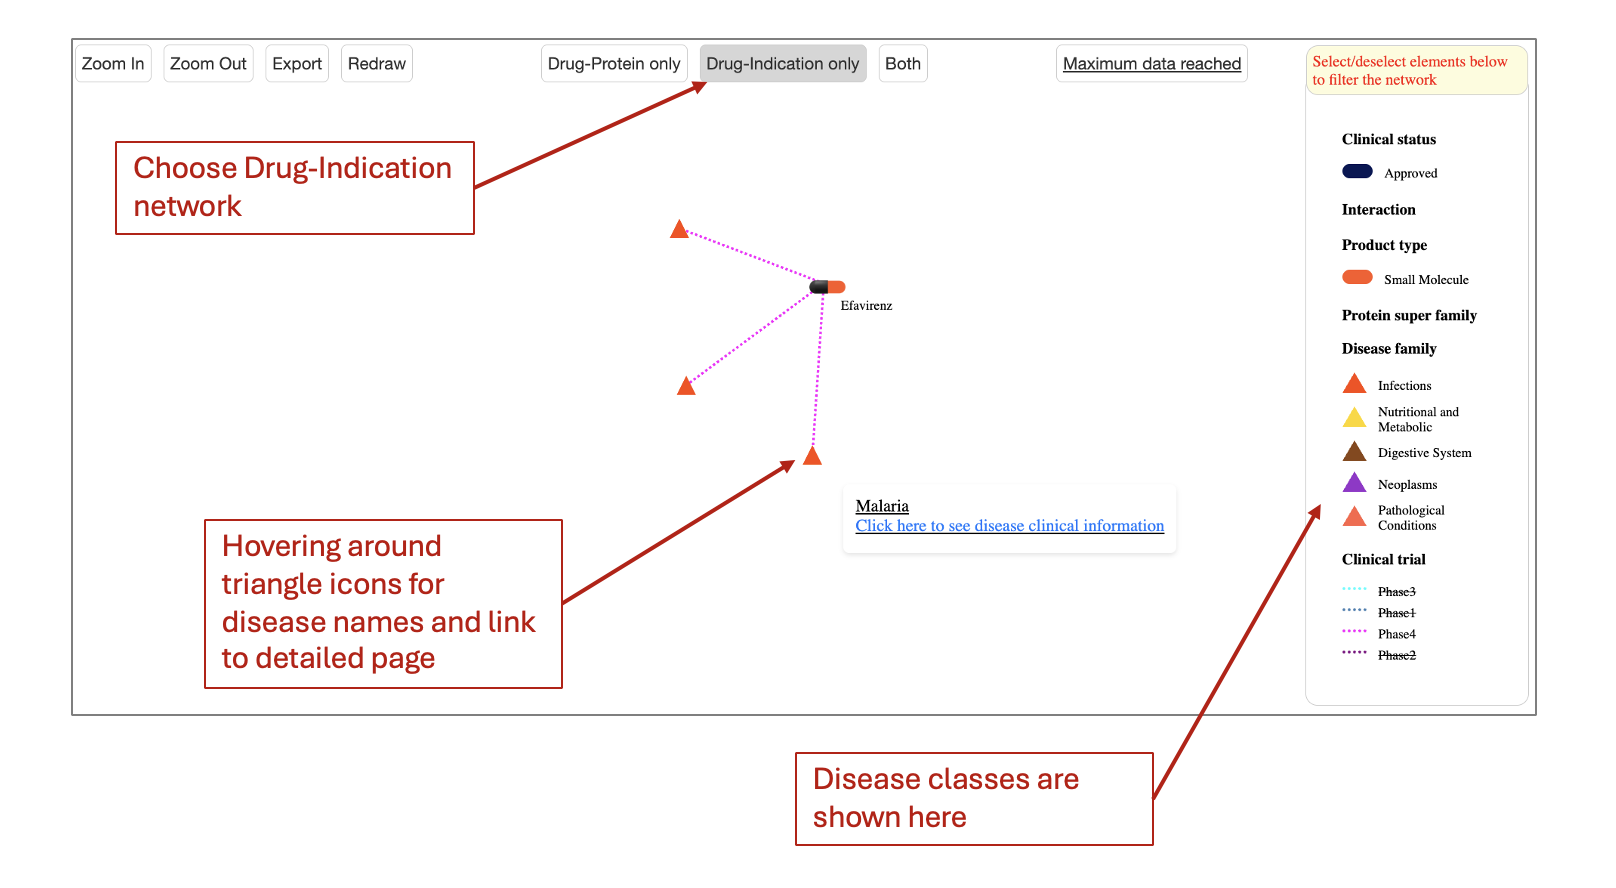
Users can look into the upper table in the right panel at the "List of diseases in studies" columns for check for disease names listed in "Phase 4" line. For more information, in the pop-up diaglog, users can check in the box for "Phase 4". The drug-disease network will be shown where users could also see classes of diseases. When hovering around disease icons (in triangle shapes), a link for further disease information will be shown
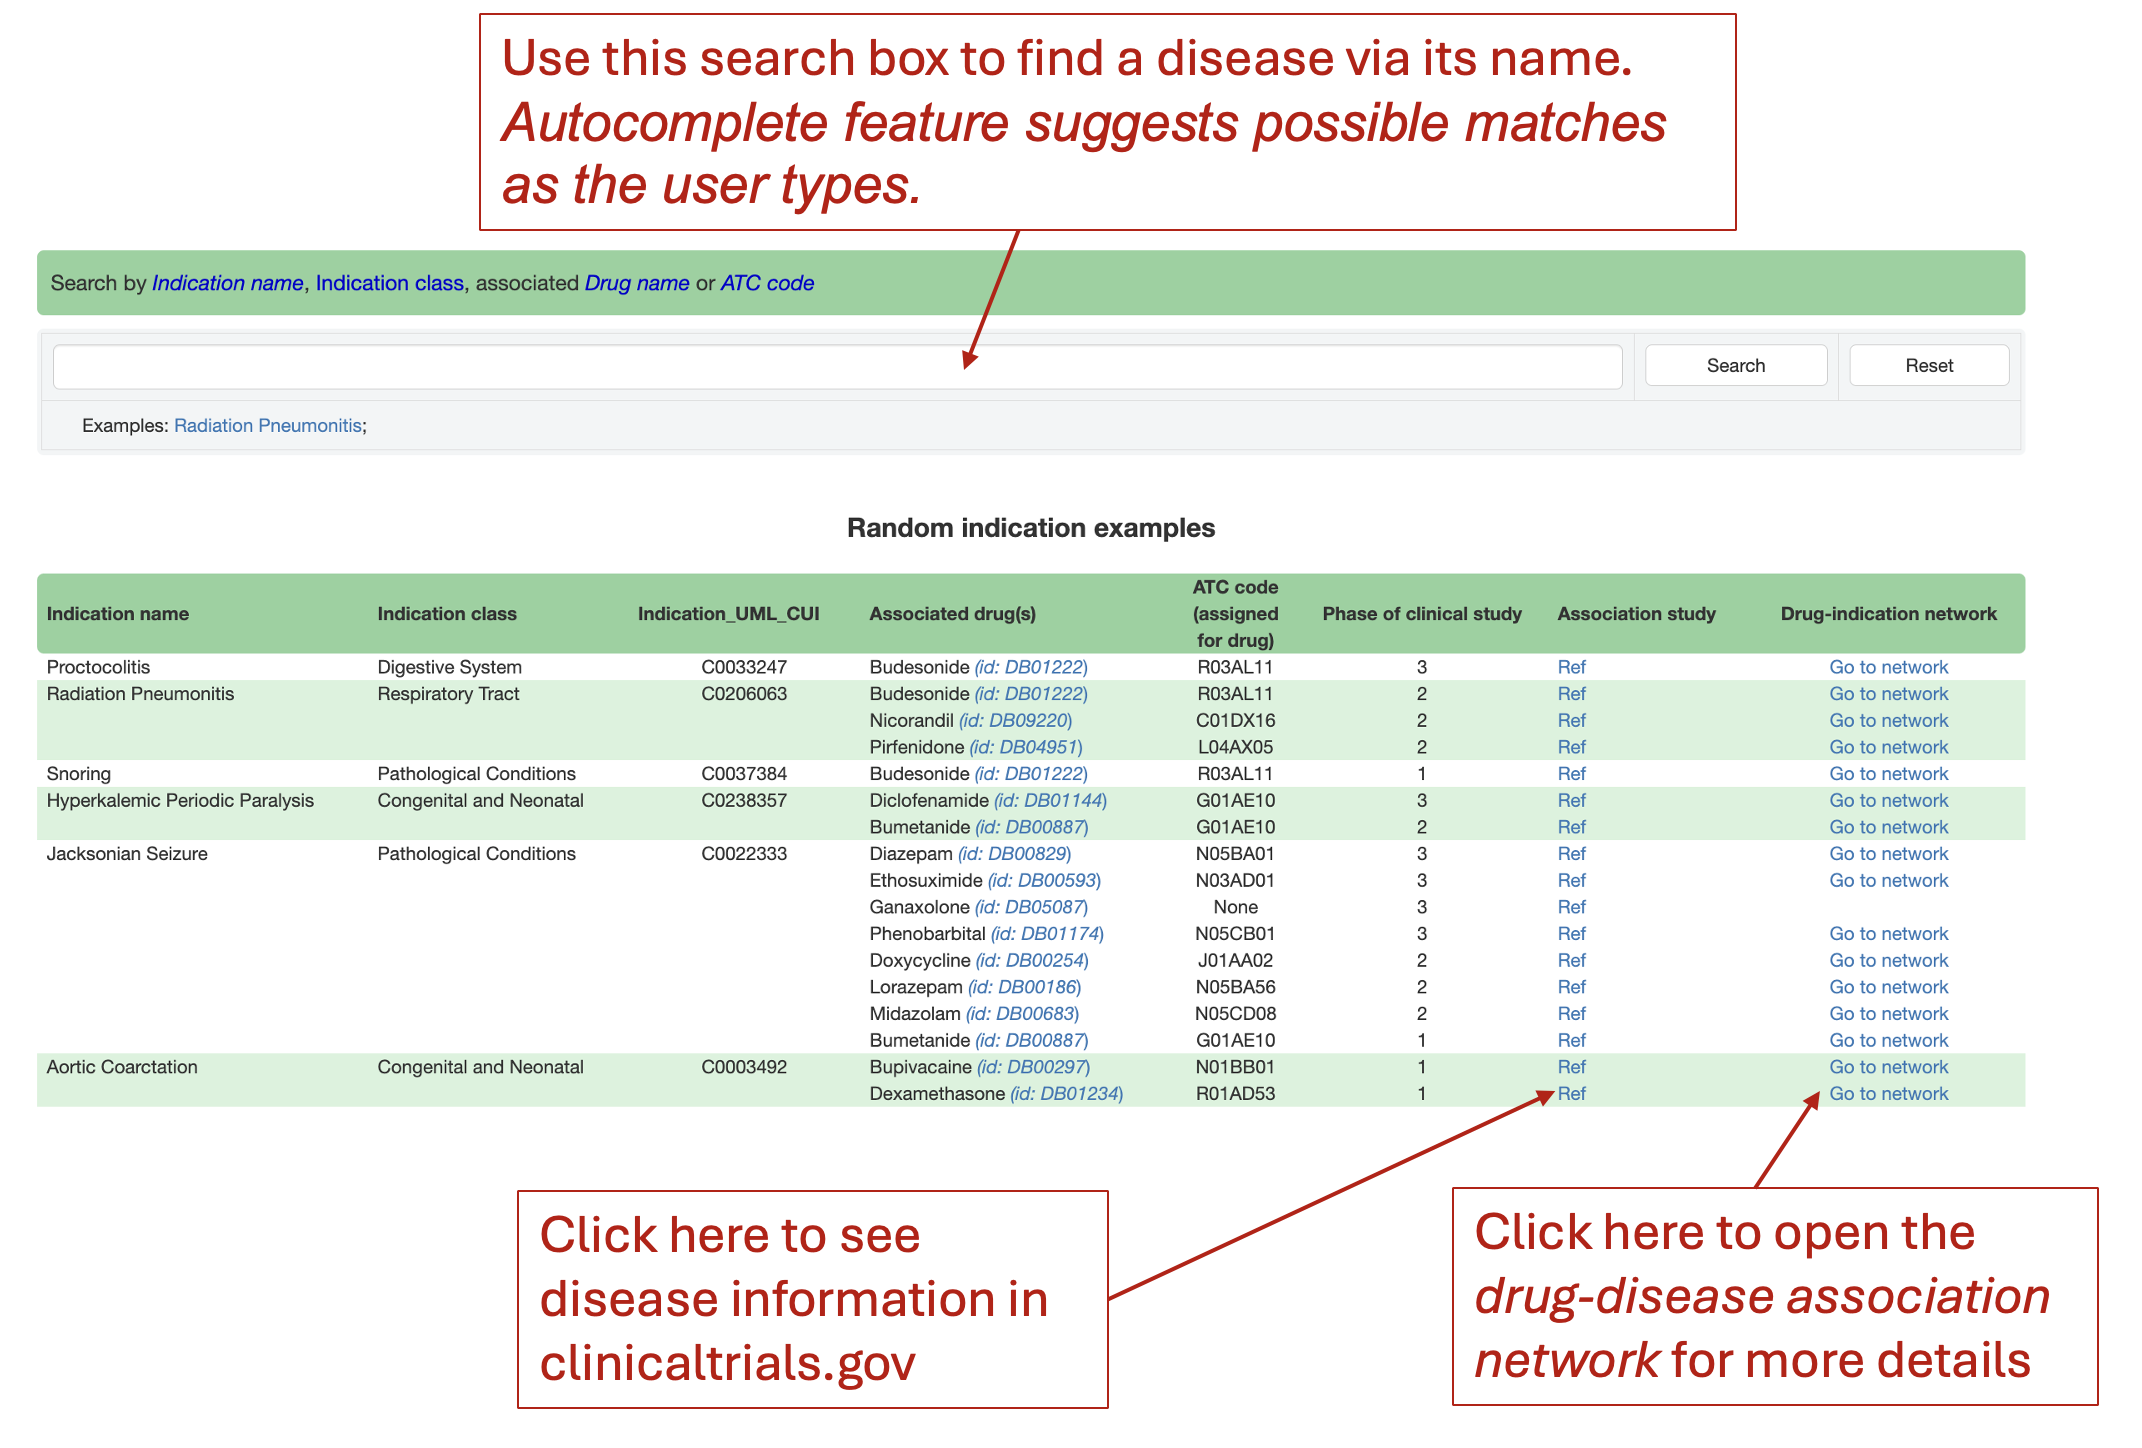
Search an indication of interest
Users can input an indication name on the 'Indication search' page to launch the search process. The table beneath gives quick indication examples
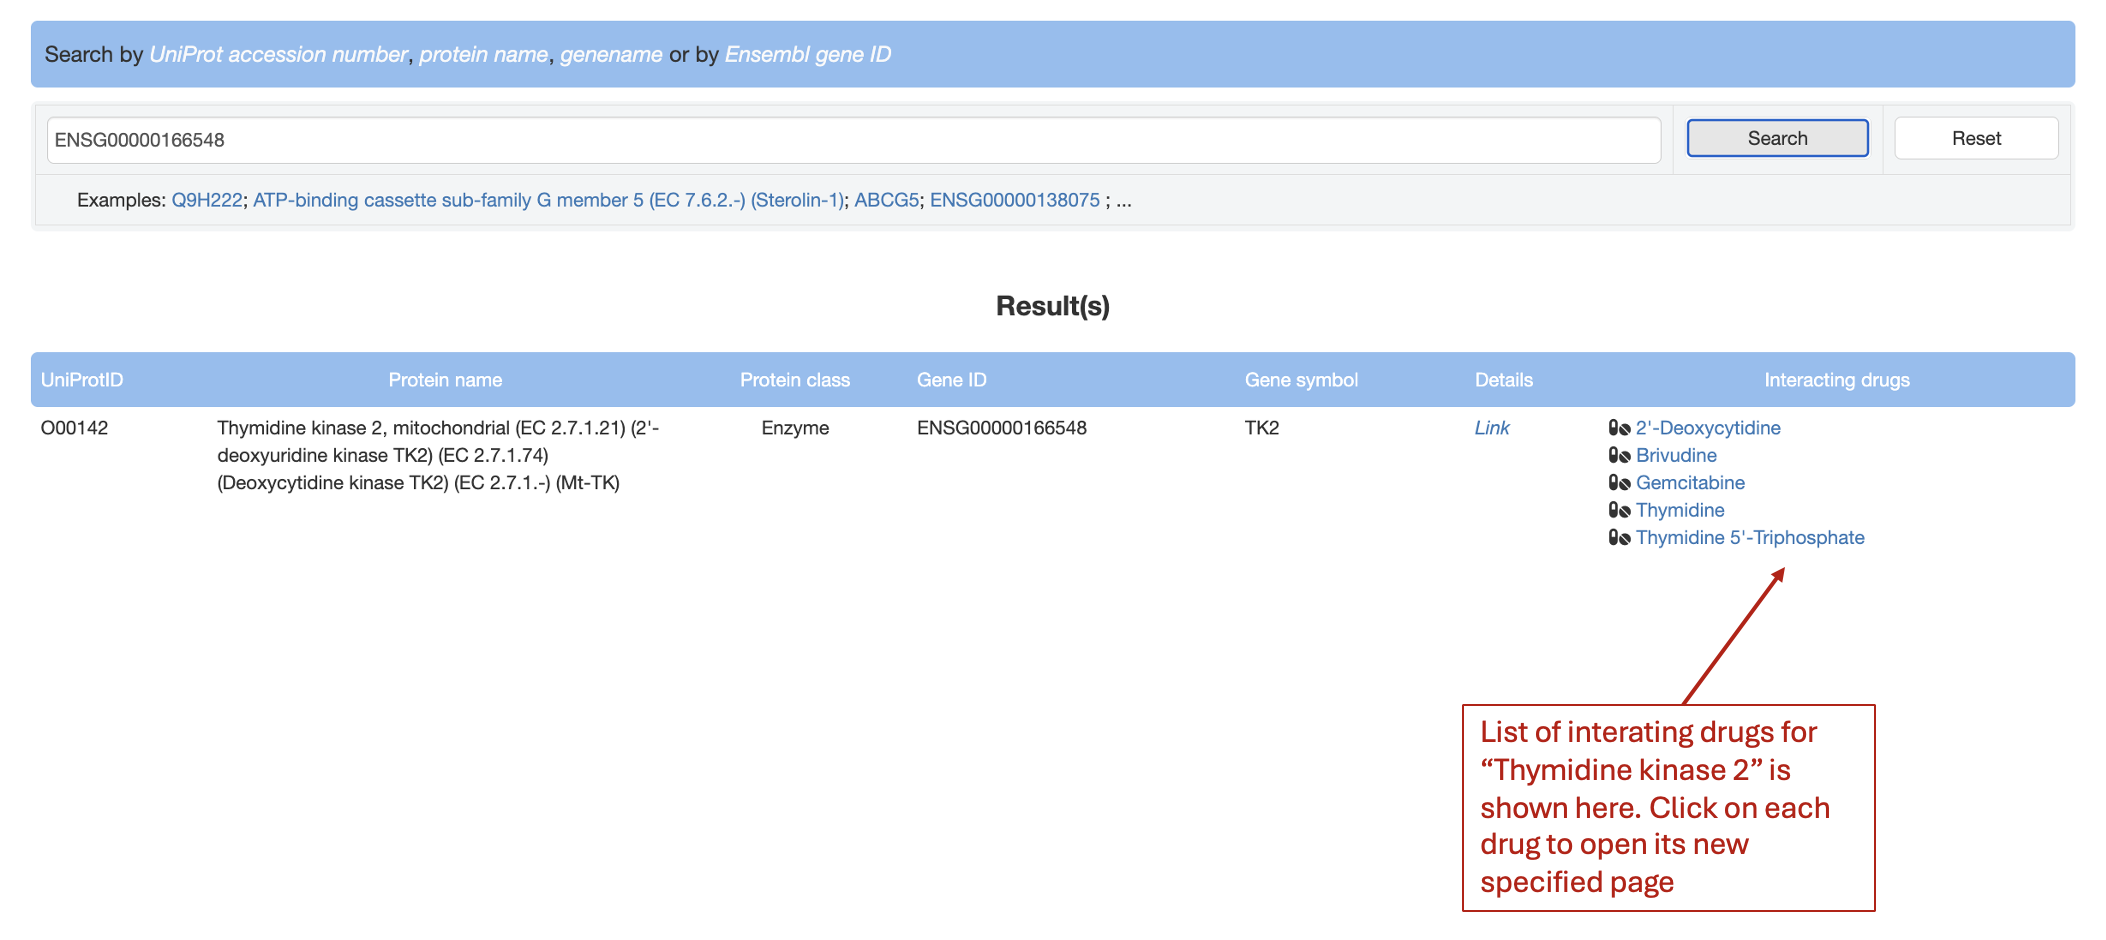
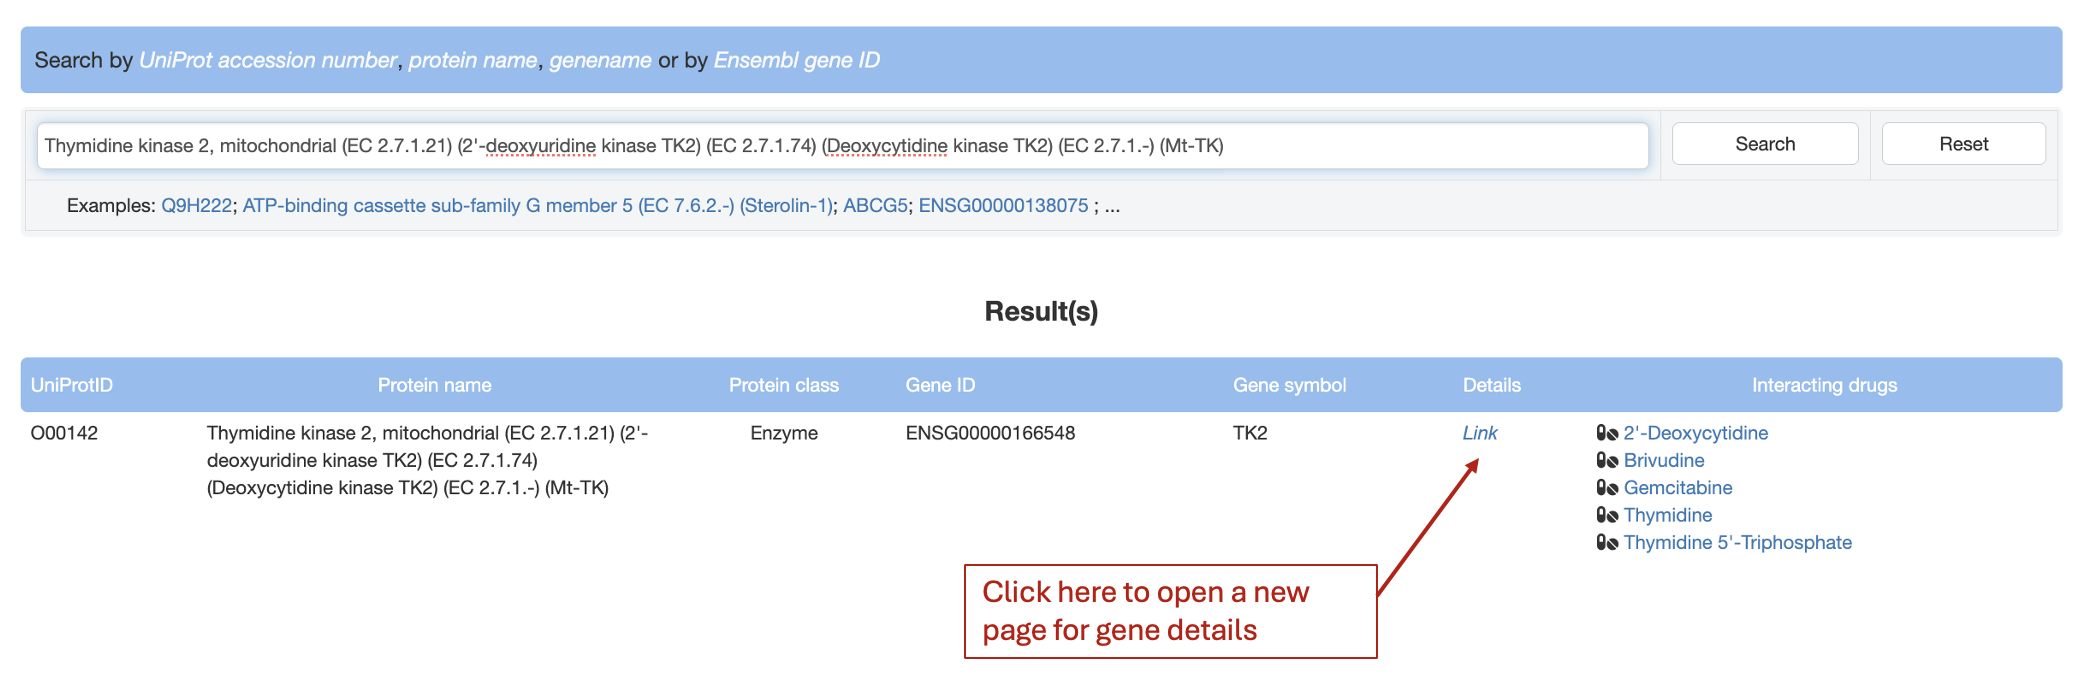
Search a protein/target/gene of interest
Users can input a single protein name or protein uniprot ID or gene name or gene identifier on the 'Protein search' page to launch the search process. The table beneath gives quick protein examples
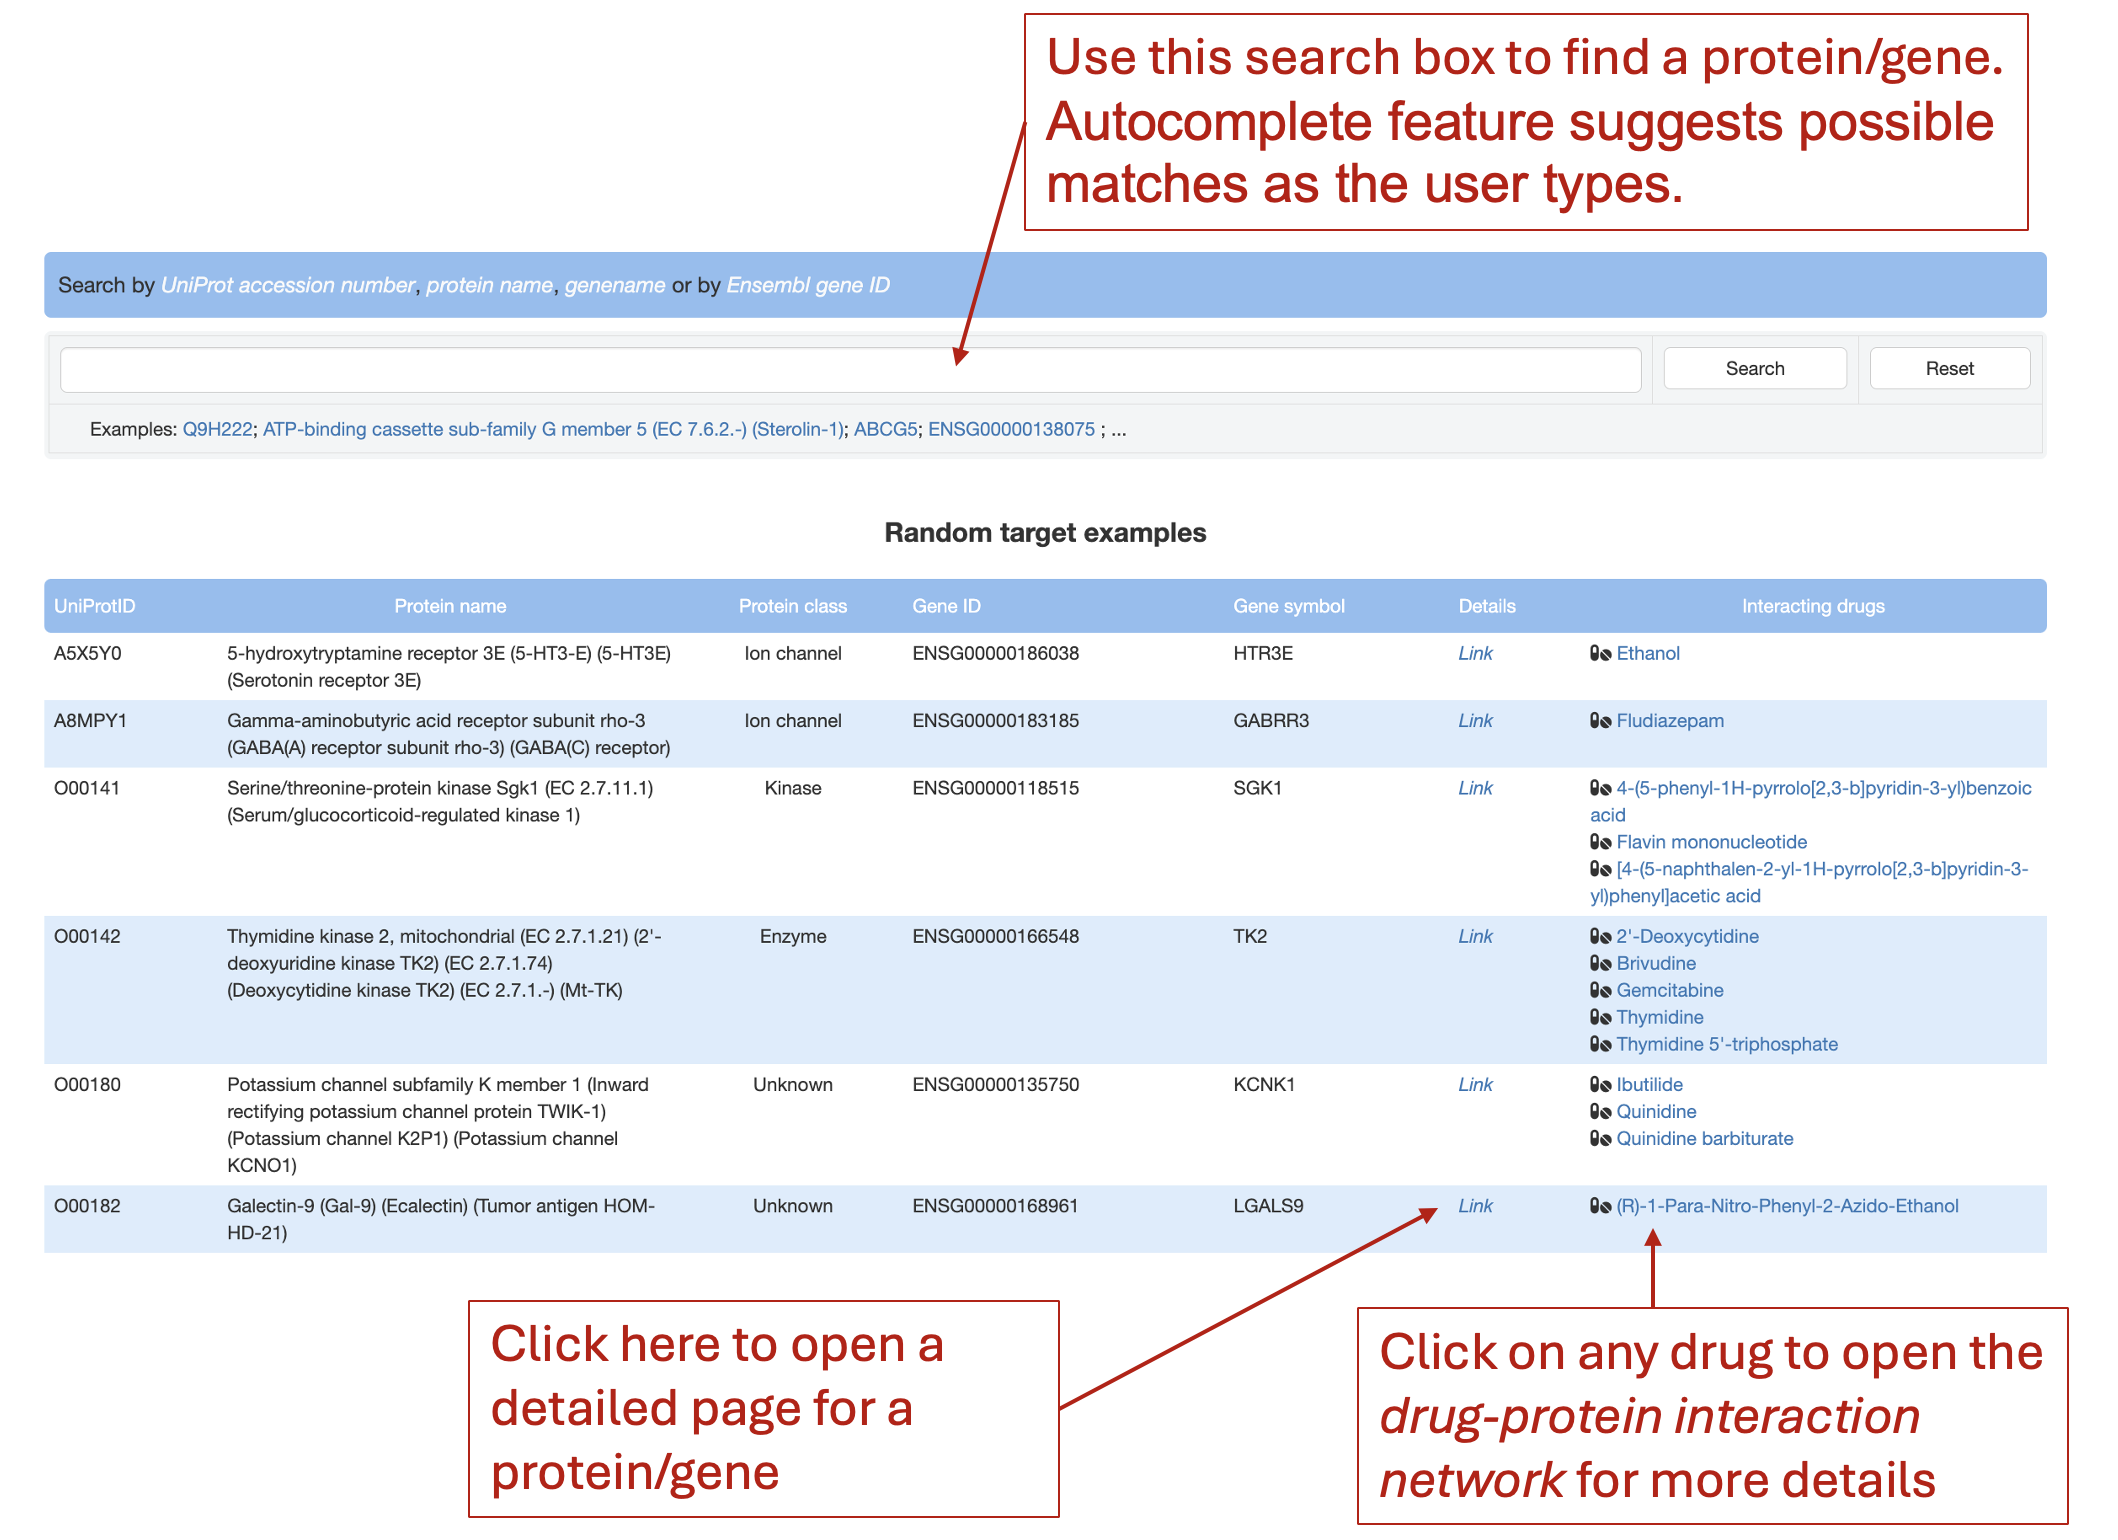
Find drugs interacting with a protein
Users can input a single protein name or protein uniprot ID or gene name or gene identifier on the 'Protein search' page to launch the search process. The table beneath gives quick protein examples
In the result table, look at the "Interacting drugs" column to see the list of drugs interacting (targeting, or being transported, carried or catalysed) by this protein
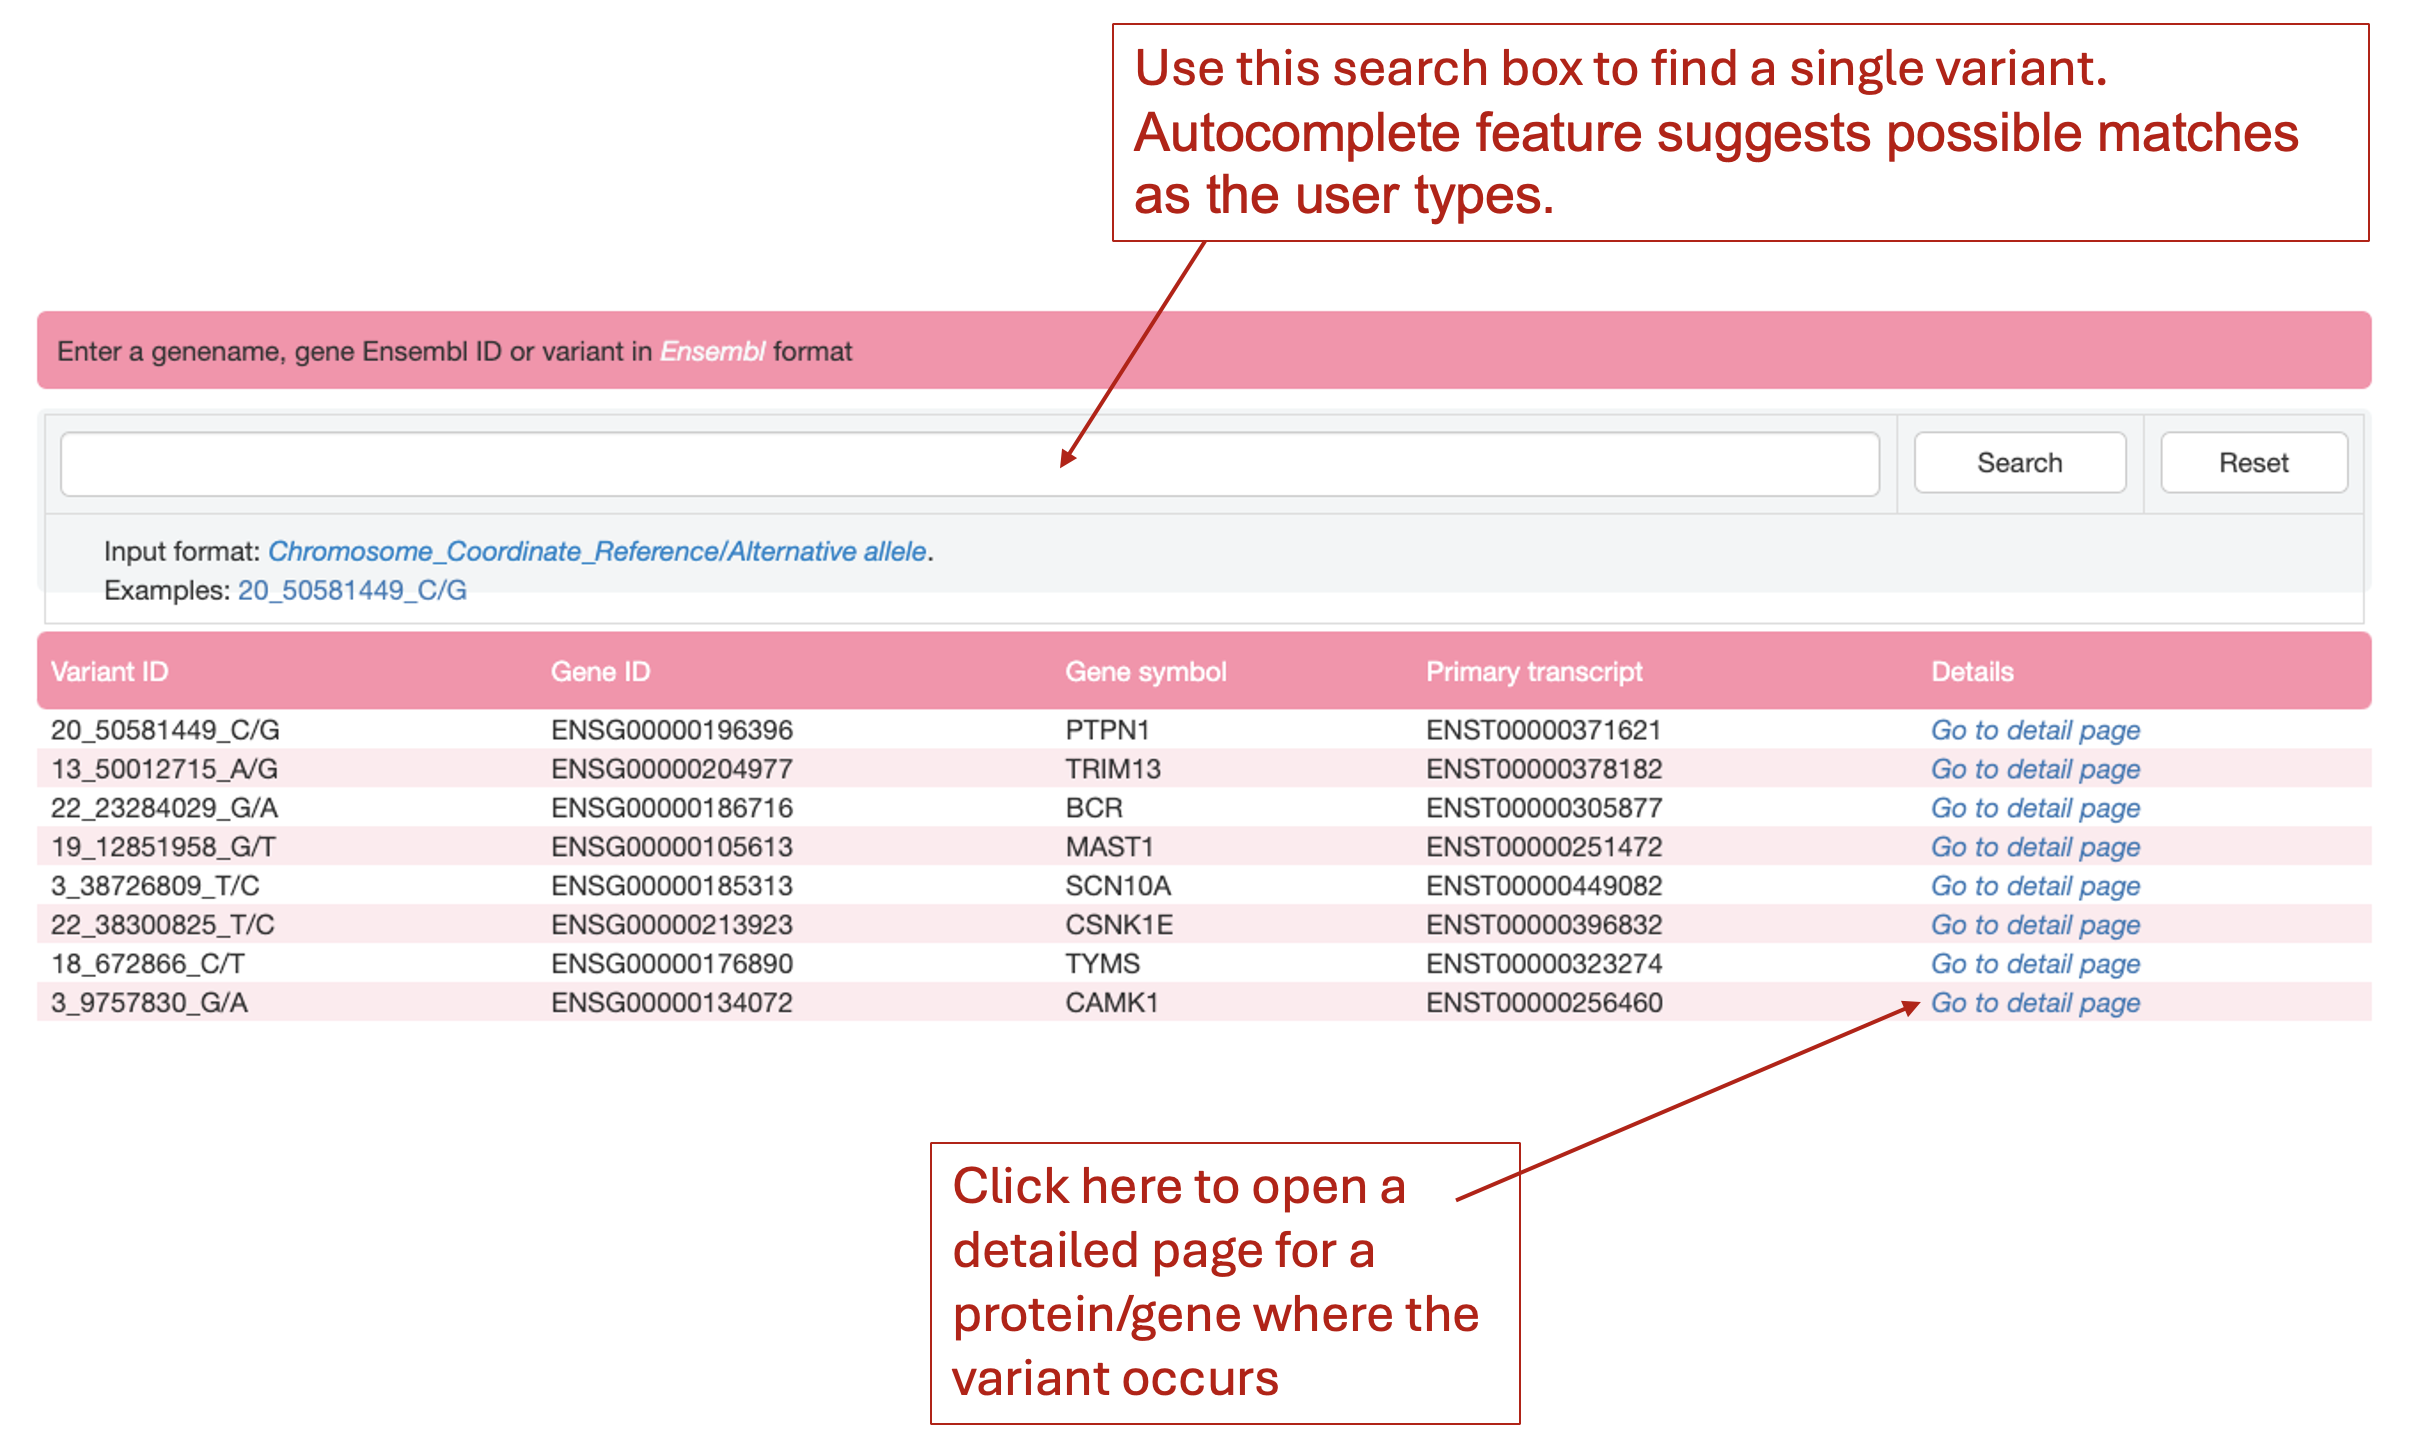
Search a variant of interest
Users can input a single variant identifier on the 'Variant search' page to launch the search process. The table beneath gives quick variant examples
Evaluate the overall impact of a variant
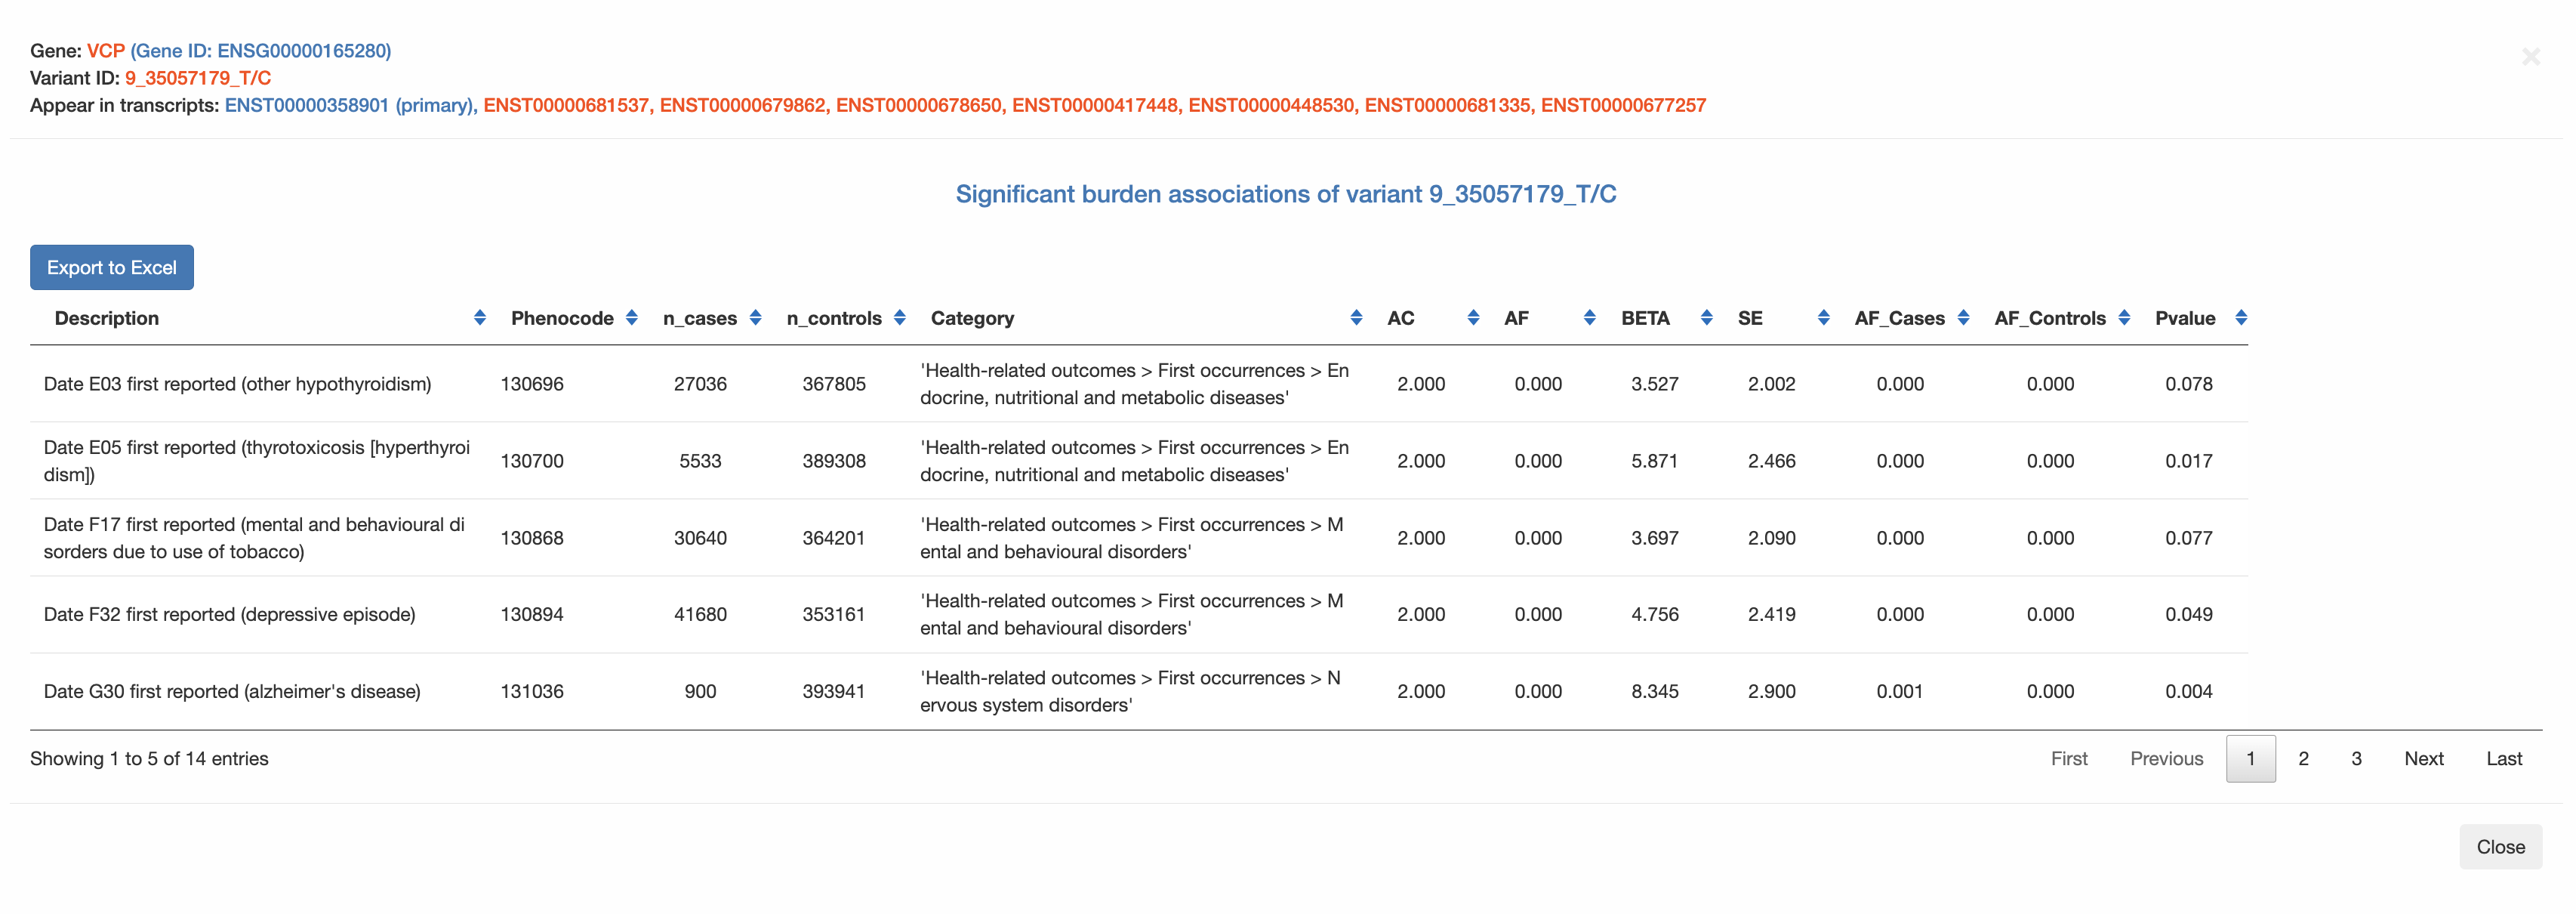
Objective: Find the predicted impact of a protein-coding genetic variant. Given a healthcare professional identifies a variant of interest in a patient, which has not been listed on drug labels for PGx-testing previously.
How: Navigating to the 'Variant search' page, enter the variant identifier (e.g. 9_35057179_T/C) in the search box.
Expected results: (This screenshot shows only a portion of the full results).
Table showing basic annotation and predicted variant effect scores of variant 9_35057179_T/C
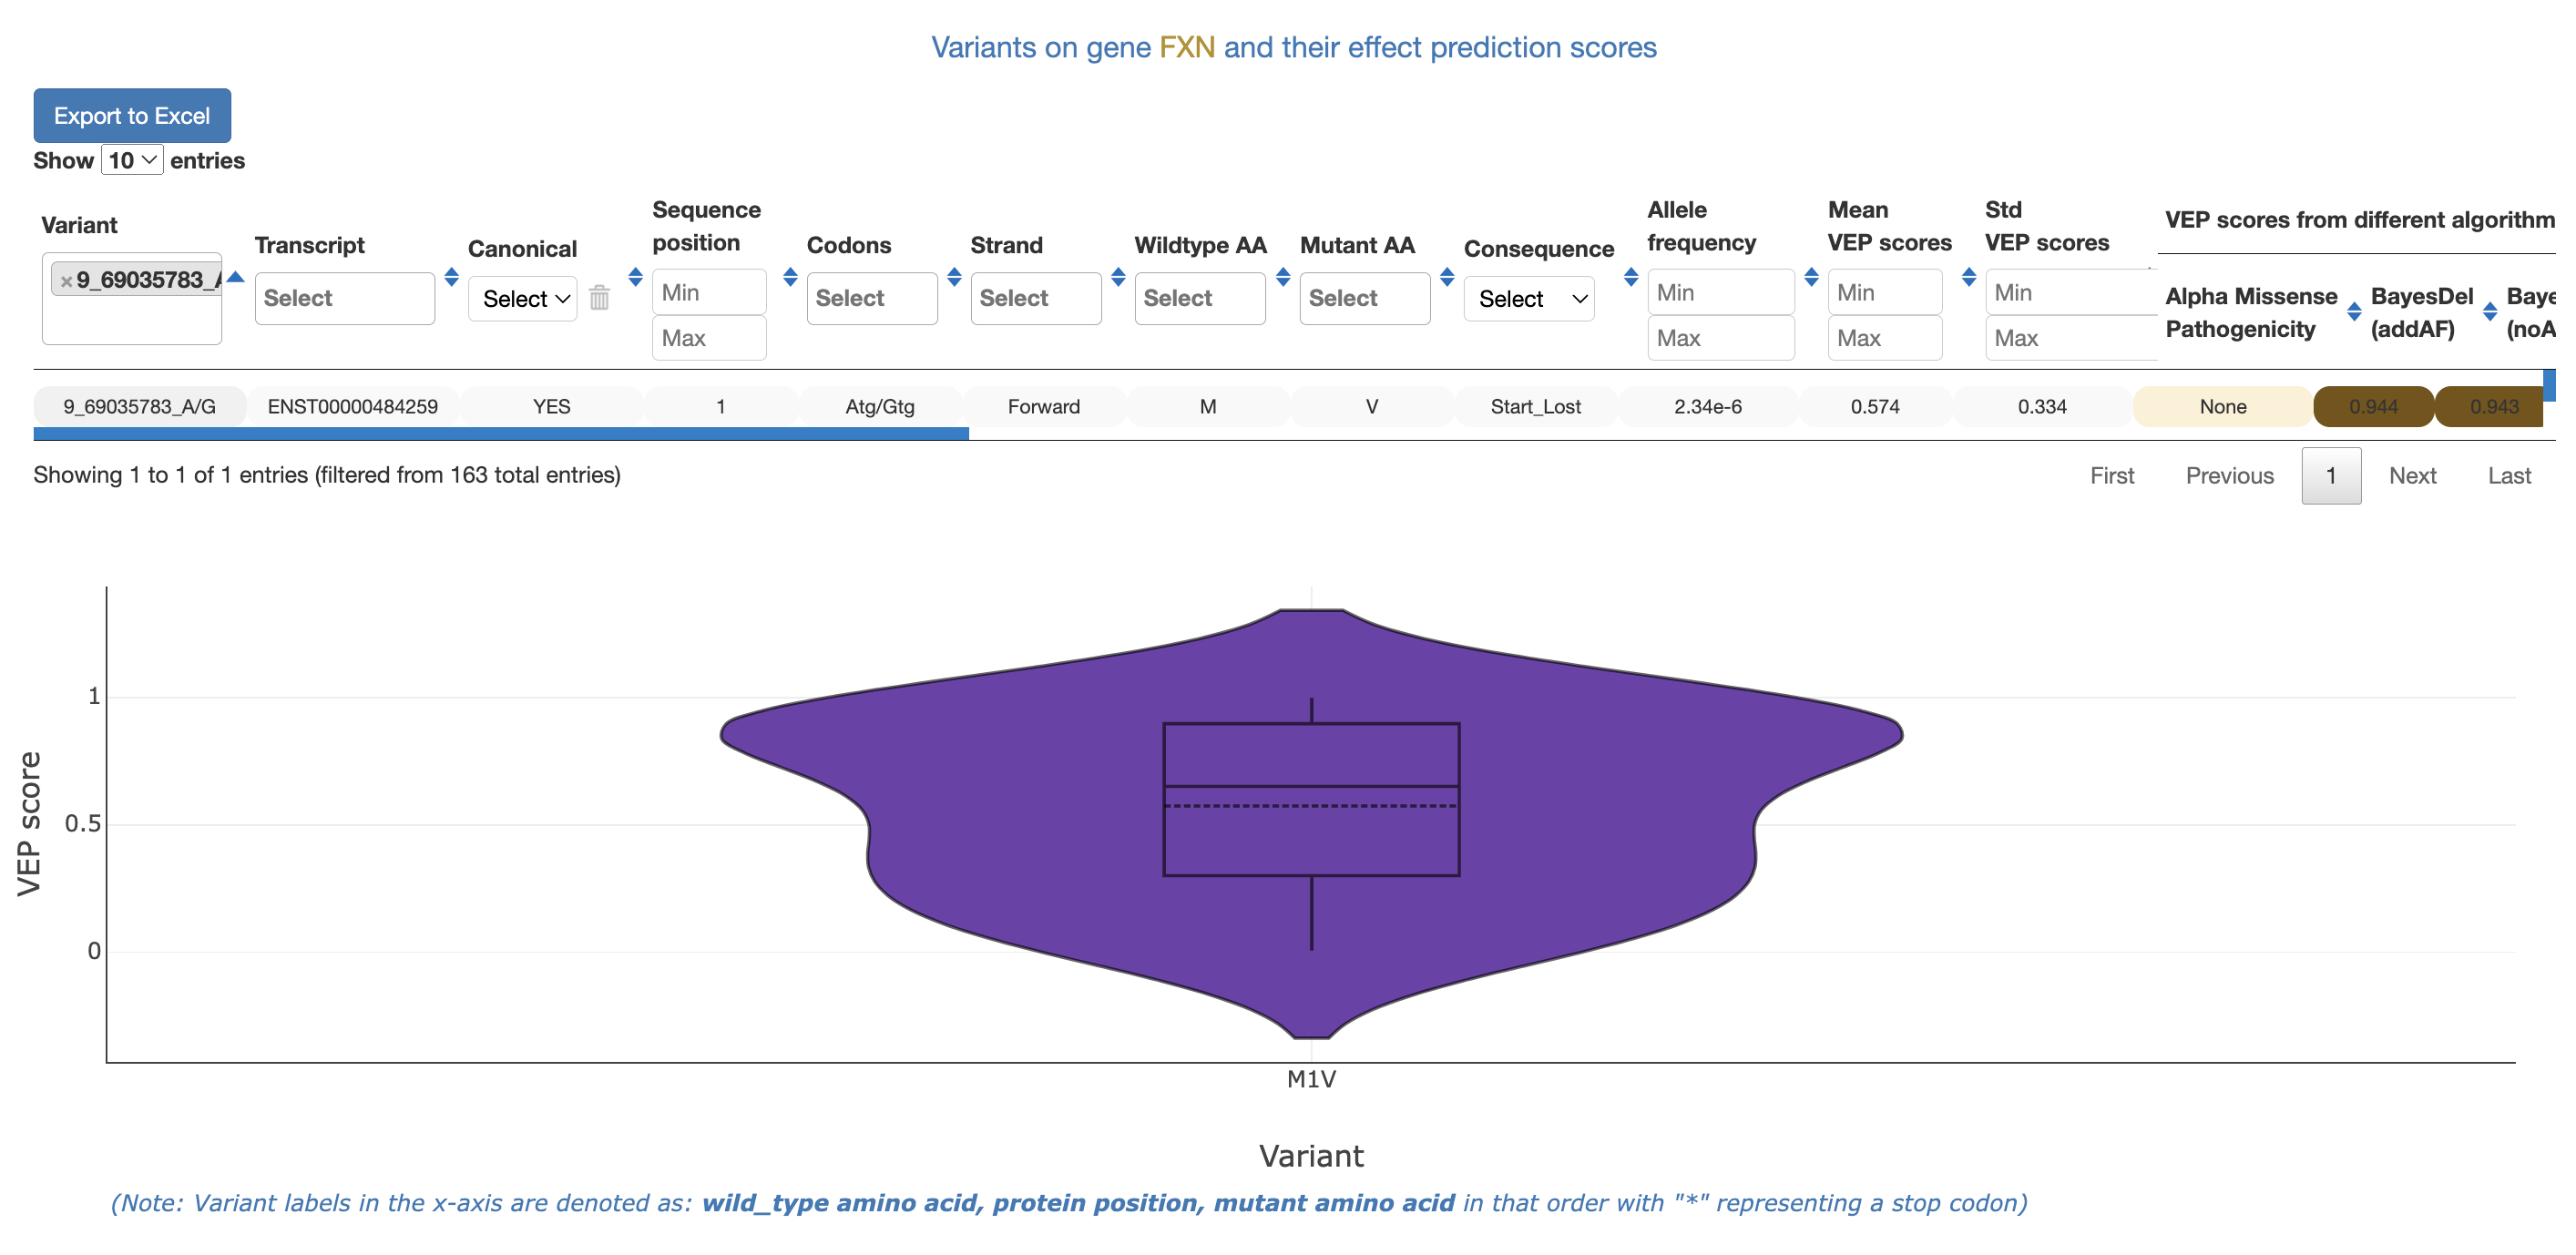
Table showing Significant burden associations of variant 9_35057179_T/C
Find residues with signigicant effects in a protein
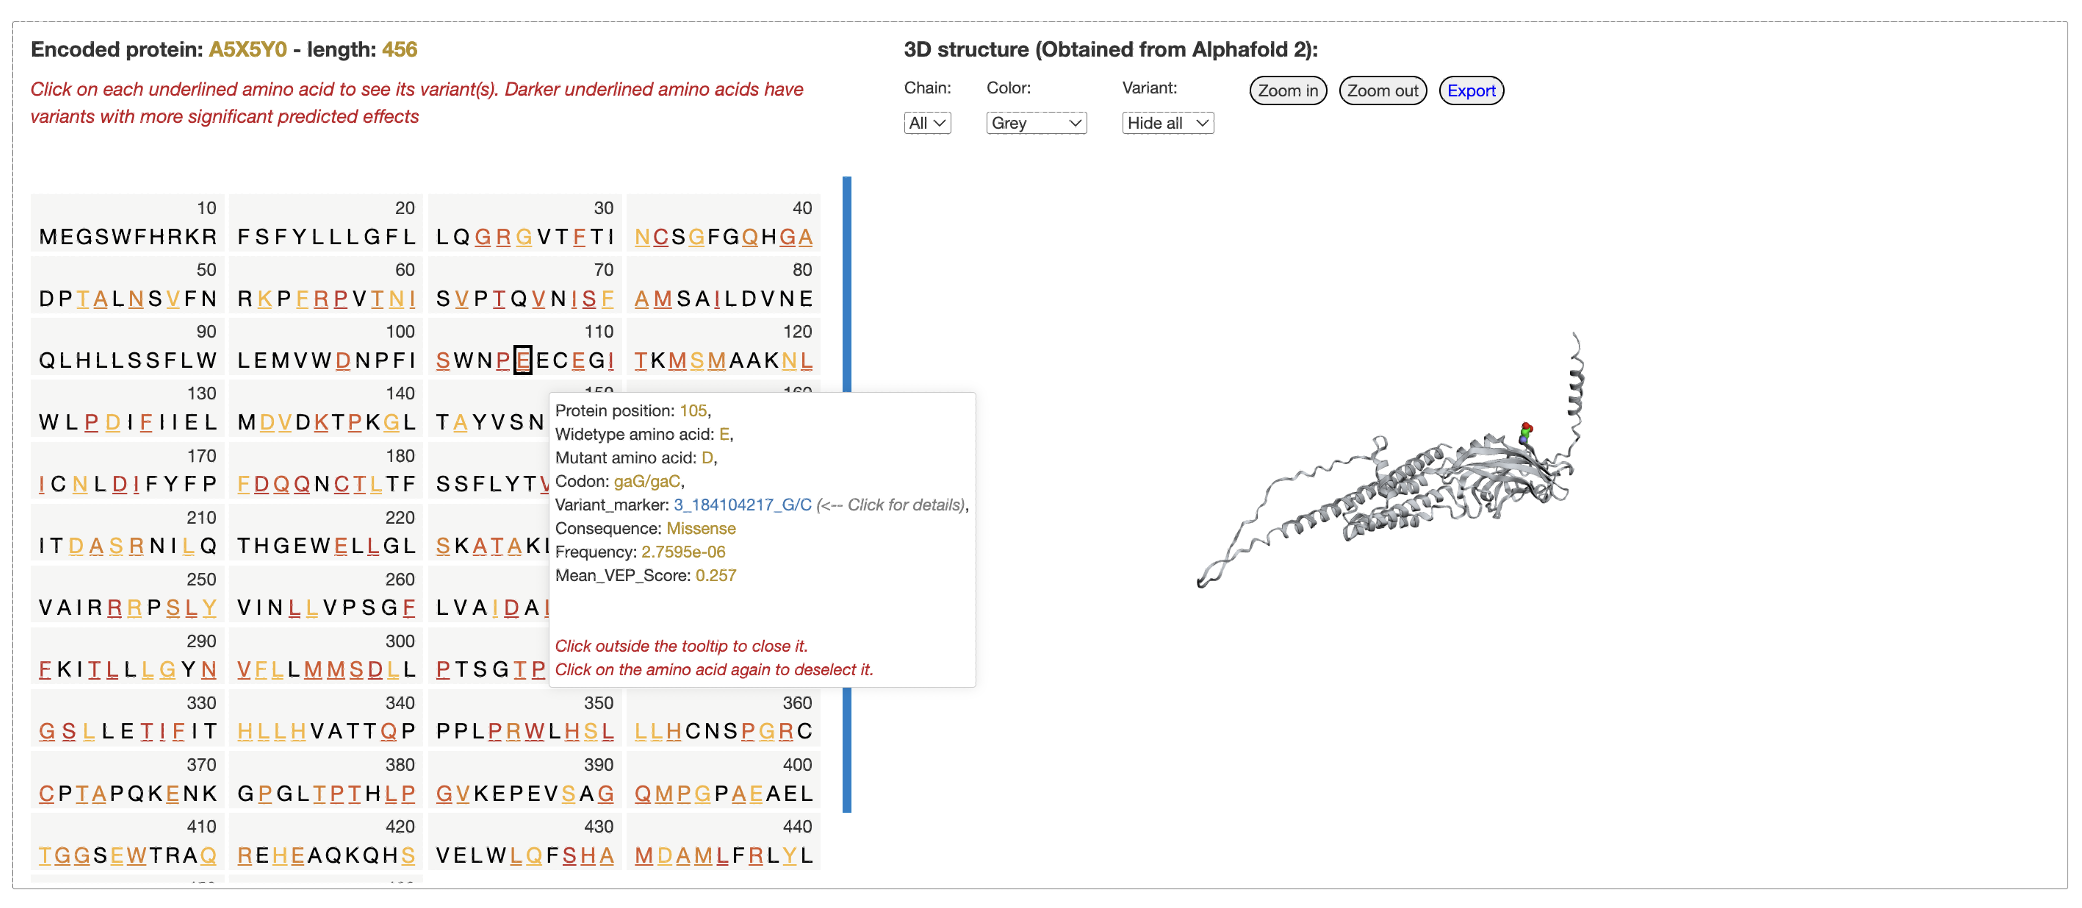
Objective: given a protein, find residue spots that have variants with high predicted effect scores.
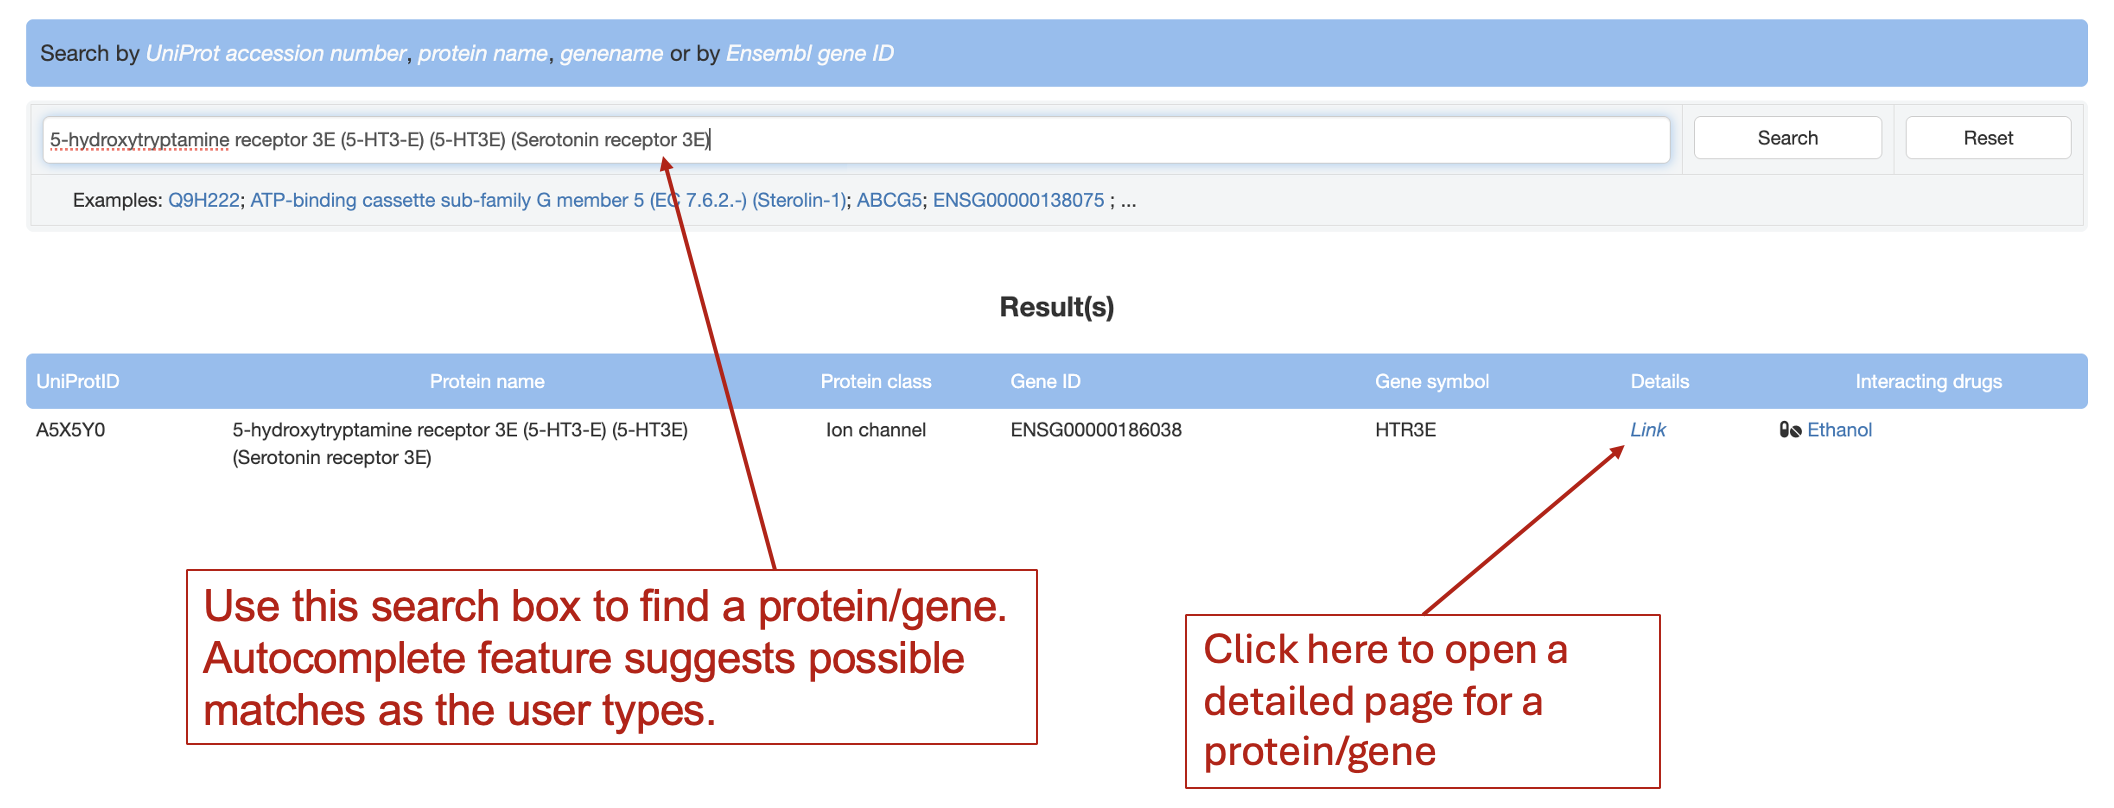
How: First, navigating to the 'Target search' page, enter the protein UniProt accession number or protein name or gene name (e.g. Serotonin receptor 3E) in the search box. Second, click on "Link" in the "Details" column in the "Result(s)" table.
Expected results: (This screenshot shows only a portion of the full results).
Search result table
The upper left panel of the new page opened shows color-coded amino acids of the protein. Underlined residues with darker colors have variants with higher predicted significant effects. Click on interested residues to see their variant information.
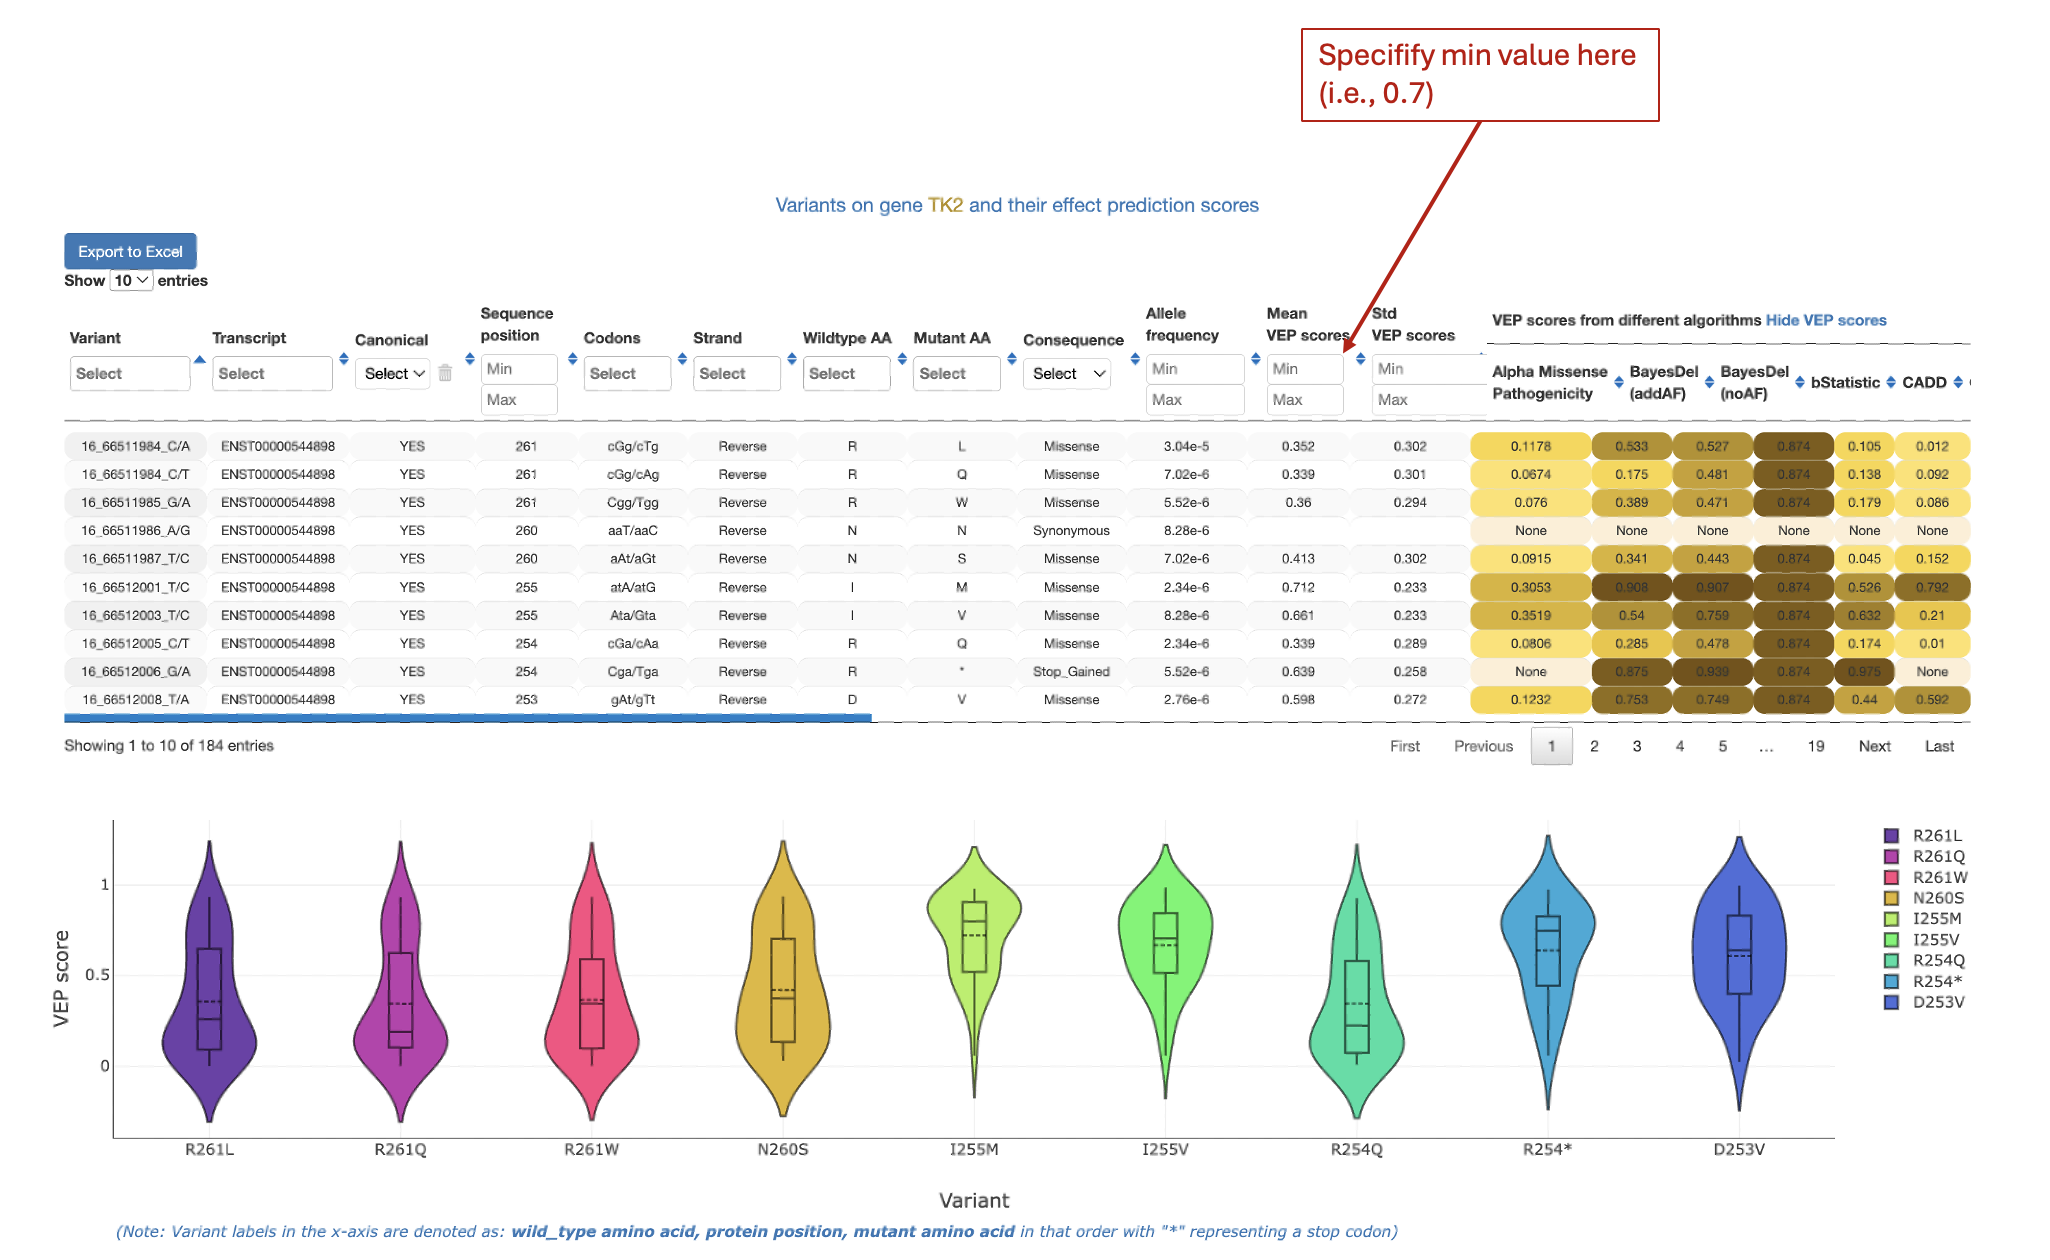
Find missense variants with predicted effect scores above a value, i.e, 0.7, given a gene
Input a gene name, gene ID or protein name on the 'Protein search' page to launch the search process. In the result table, click on the link in the "Details" column to open the specific page for that gene/protein
In the new page, look at the lower right: the first column shows all variants of this gene while the "Mean VEP scores" columns shows the mean of variant effect prediction scores for each variant from 40 different prediction algorithms. Users can use "Min" and "Max" input box to filter variants of interest. In this example, specify min as 0.7 this make the table shows only variants with mean VEP scores of 0.7 or higher.
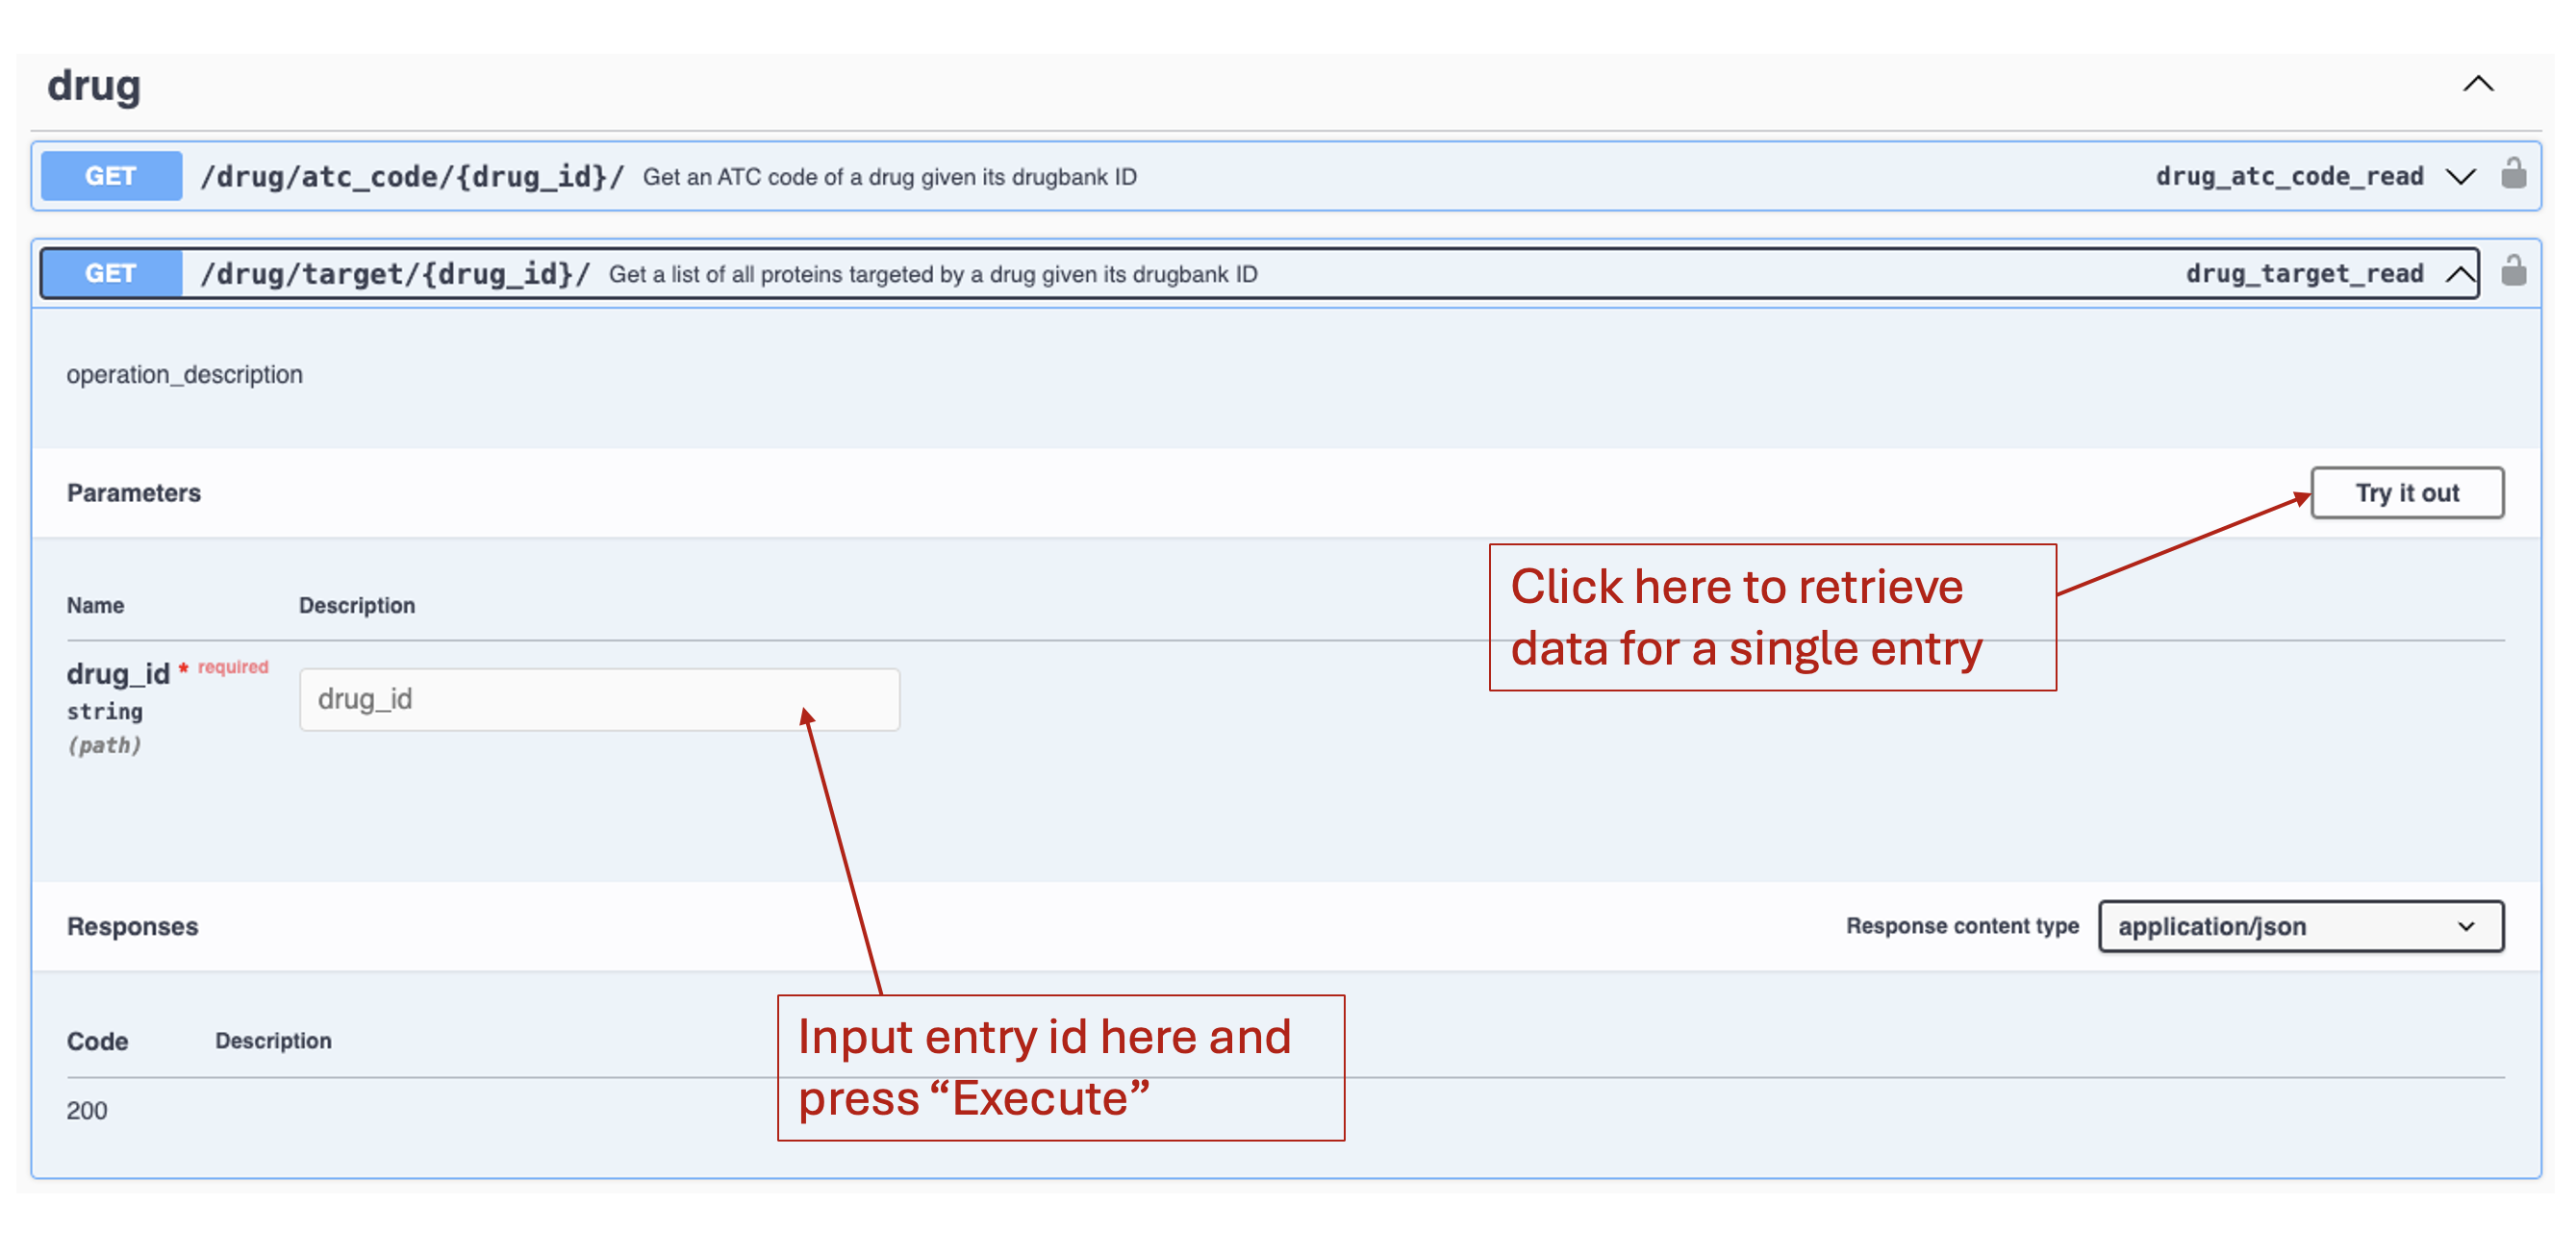
Download data programmatically
We used the REST framework (https://www.django-rest-framework.org/) to implemented 'API calls' enabling programmatic retrieval of PGx information.
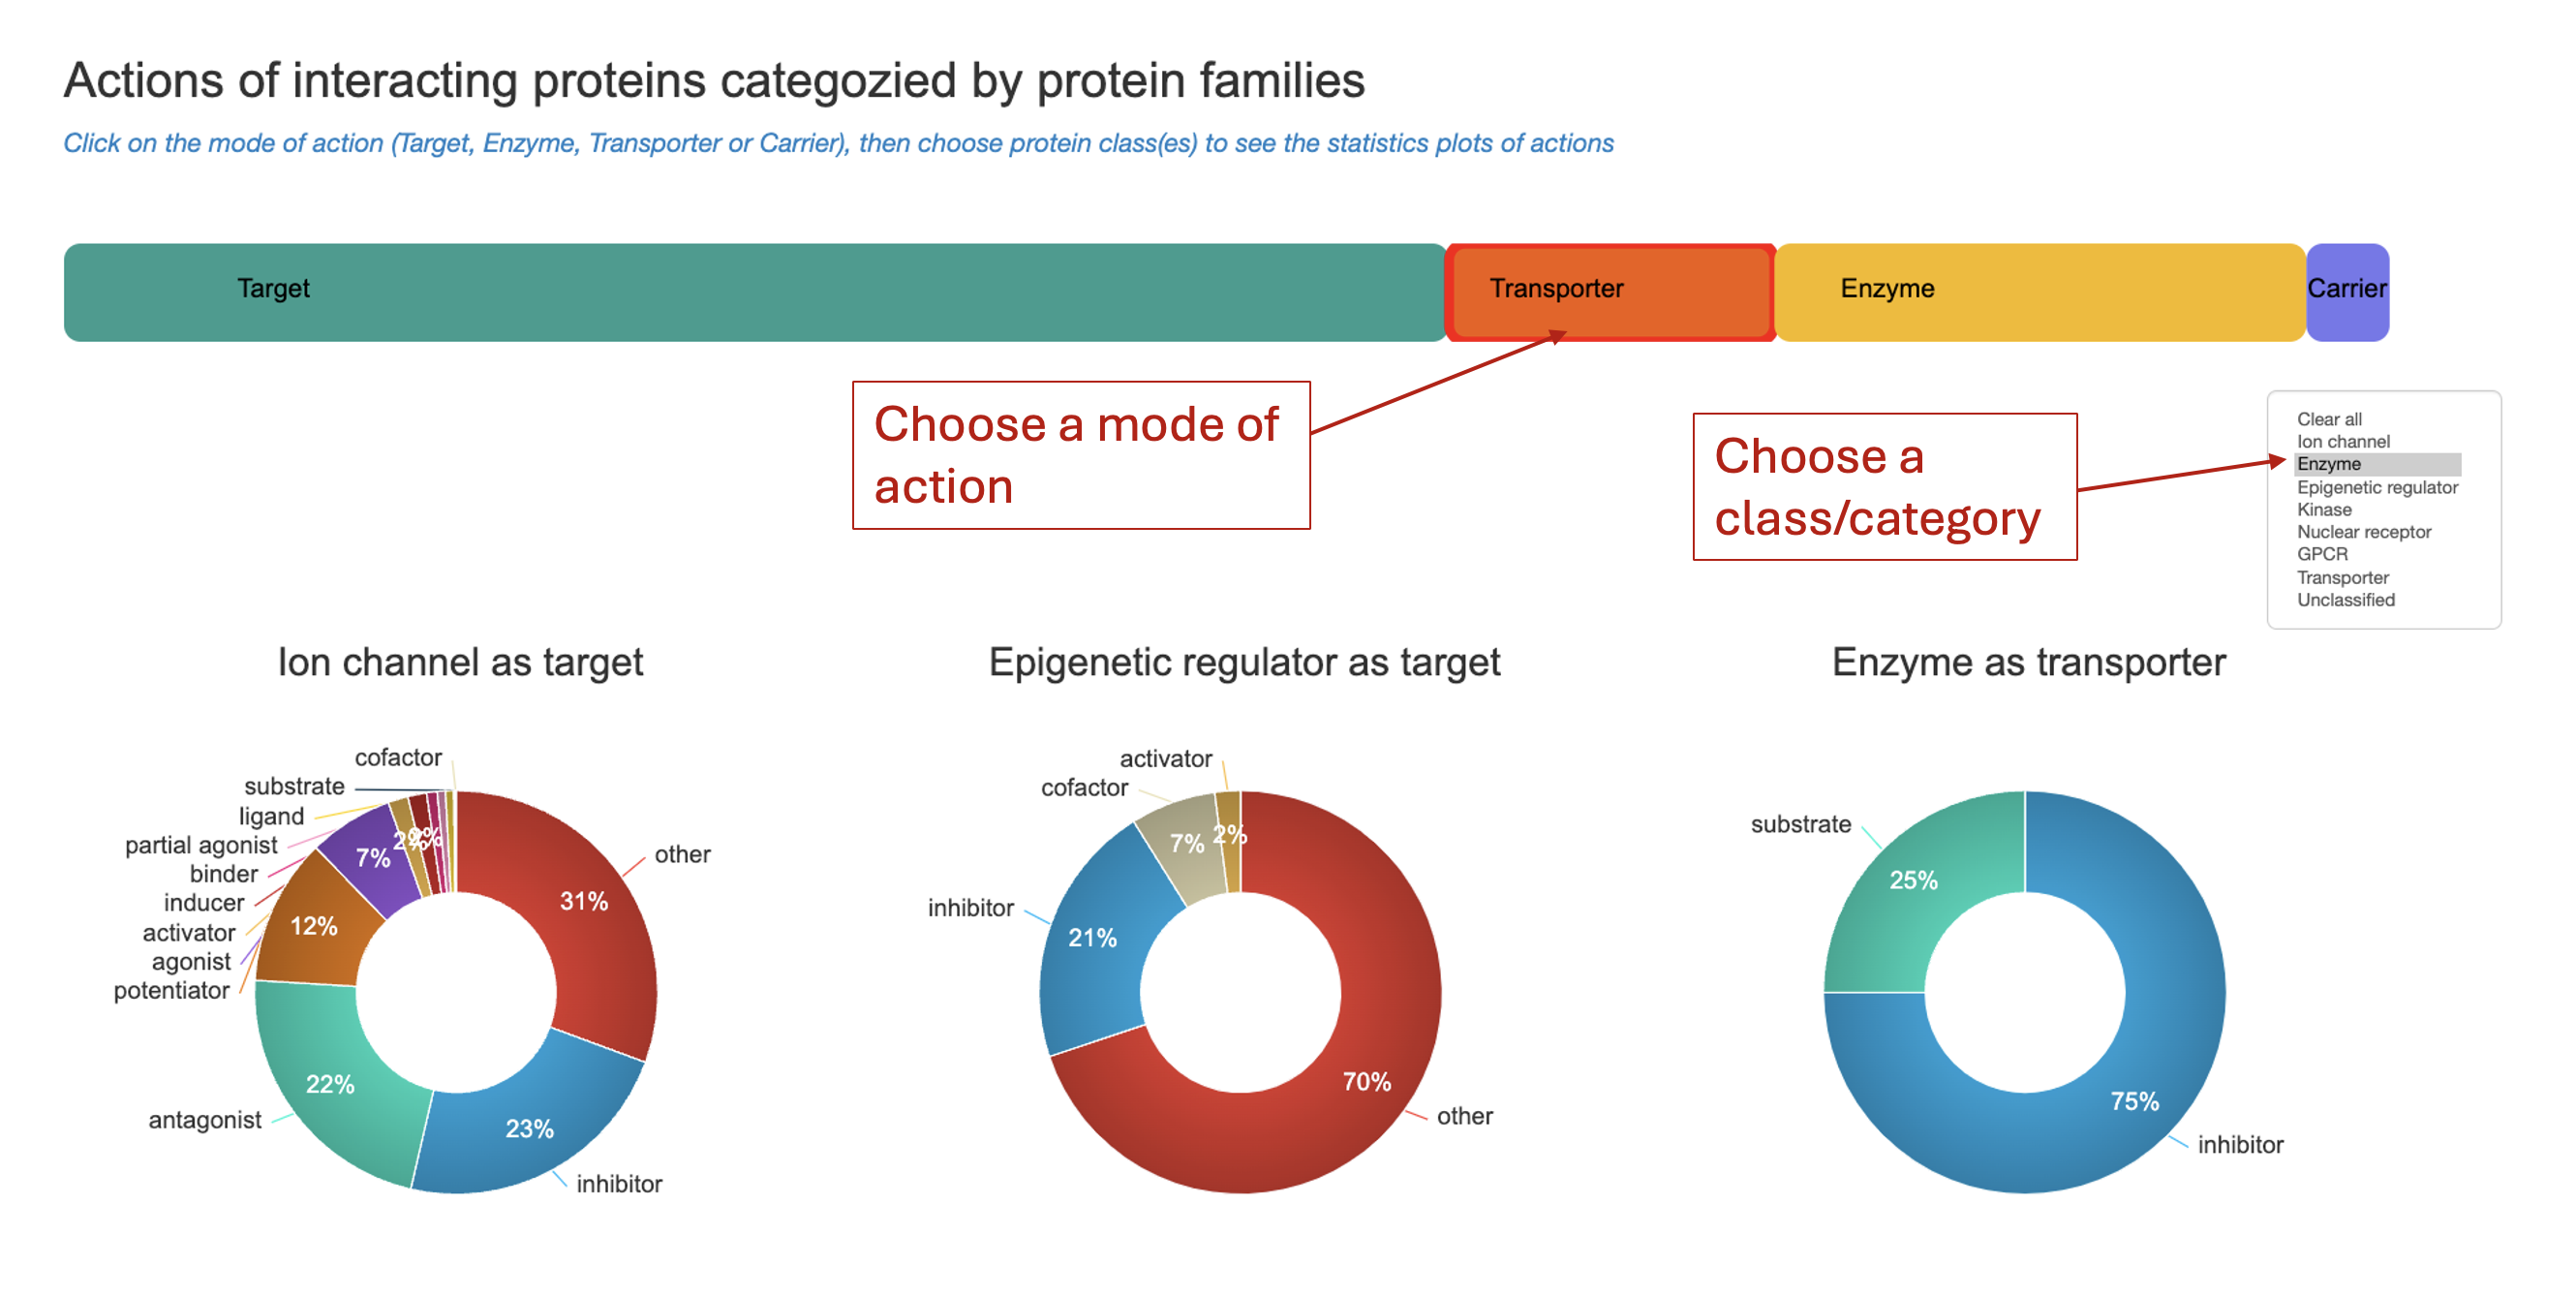
Grasp a quick overview of data of each types (drug, gene/target, disease) in PGxDB
In Target menu, choose 'Target statistics', statistics page will appear allowing users to grasp overview of target data. The similar functions are also available for drug and disease data. For each data type, user can select sub-categories to see the corresponding data distribution. A screenshot of statistics for targets is provided below as an example.